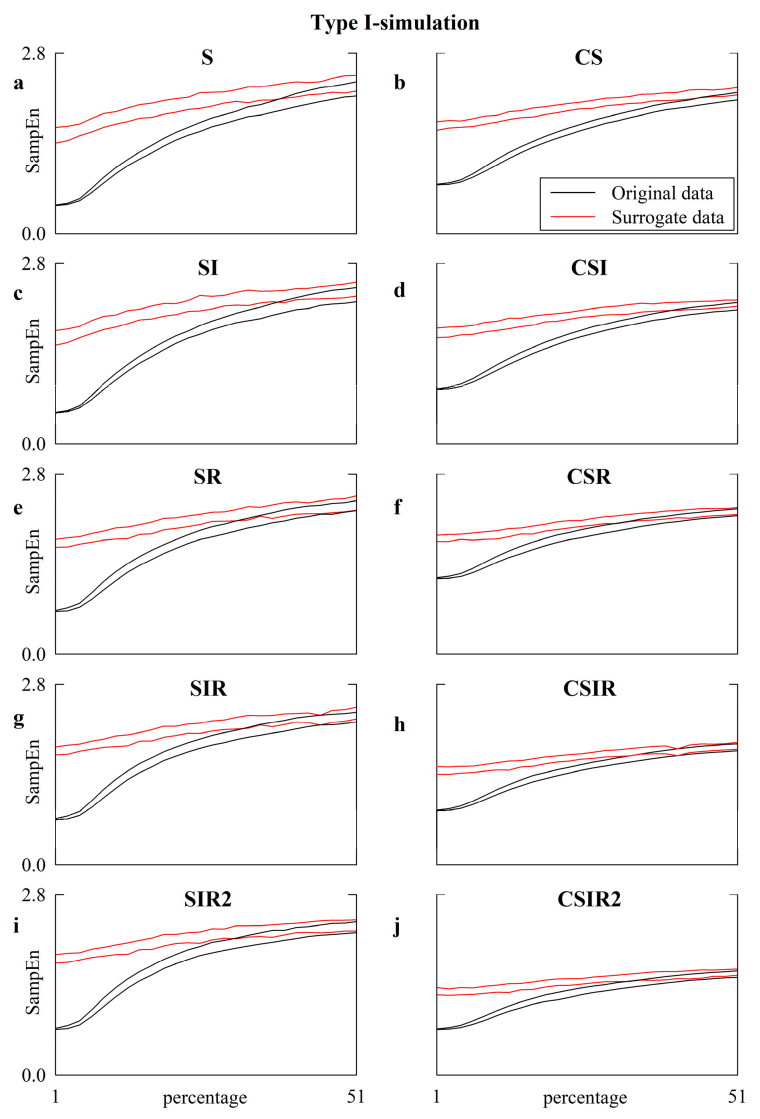
Figure 6.
The line plots show SampEn computed over the original (solid black lines) and surrogate (solid red lines) type-I simulations as a function of the amplitude of independent identically distributed white noise superimposed on the dynamic of the uncorrupted series. The amplitude of the white noise is monitored as a percentage of the standard deviation of the uncorrupted series. SampEn is computed according to the strategy of pattern matching adopted in this study, namely S (a), CS (b), SI (c) CSI (d), SR (e), CSR (f), SIR (g), CSIR (h), SIR2 (i), and CSIR2 (j). The two lines are relevant to the 2.5th and 97.5th percentiles computed over the set of simulations.

