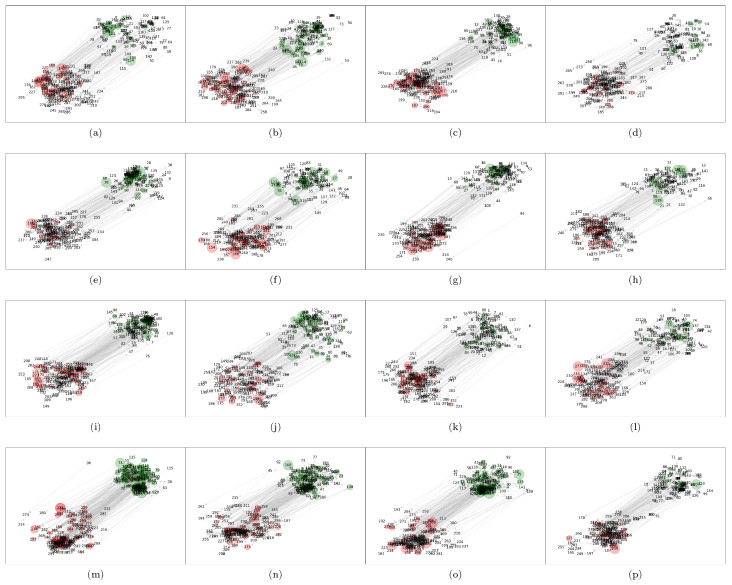
Figure 1.
Network representation of mTE results for cryptocurrency variables. The green nodes represent price-return variables, while the red nodes represent volume-return variables. The subfigures (a–p) show the directed network results for the time window under study. The subfigures are arranged in temporal order from top-left to right-bottom.

