
Figure 9.
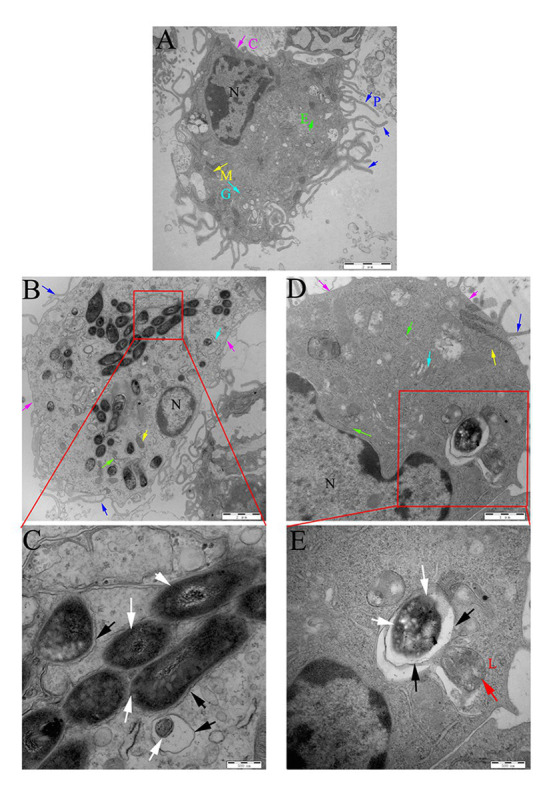
Localization of rMs (Ms261 and Ms3091) in murine peritoneal macrophages by transmission electron microscopy (TEM). (A) The ultrastructure of uninfected macrophages. Scale bar = 2 μm. (B,C) The ultrastructure of macrophages infected with Ms3091. The outlined areas in the B images (scale bar = 2 μm) are enlarged in the C images (scale bar = 500 nm). (D,E) The ultrastructure of macrophages infected with Ms261. The outlined areas in the D images (scale bar = 1 μm) are enlarged in E images (scale bar = 500 nm), lysosome (L, red arrow), nucleus (N), pseudopodia (P, blue arrows), cytoplasmic membrane (C, pink arrows), Golgi (G, cyan arrows), endoplasmic reticulum (E, green arrows), and mitochondrion (M, yellow arrows). Bacteria cell walls are marked with white arrows. Phagosomal membranes surrounding bacteria are marked with black arrows.