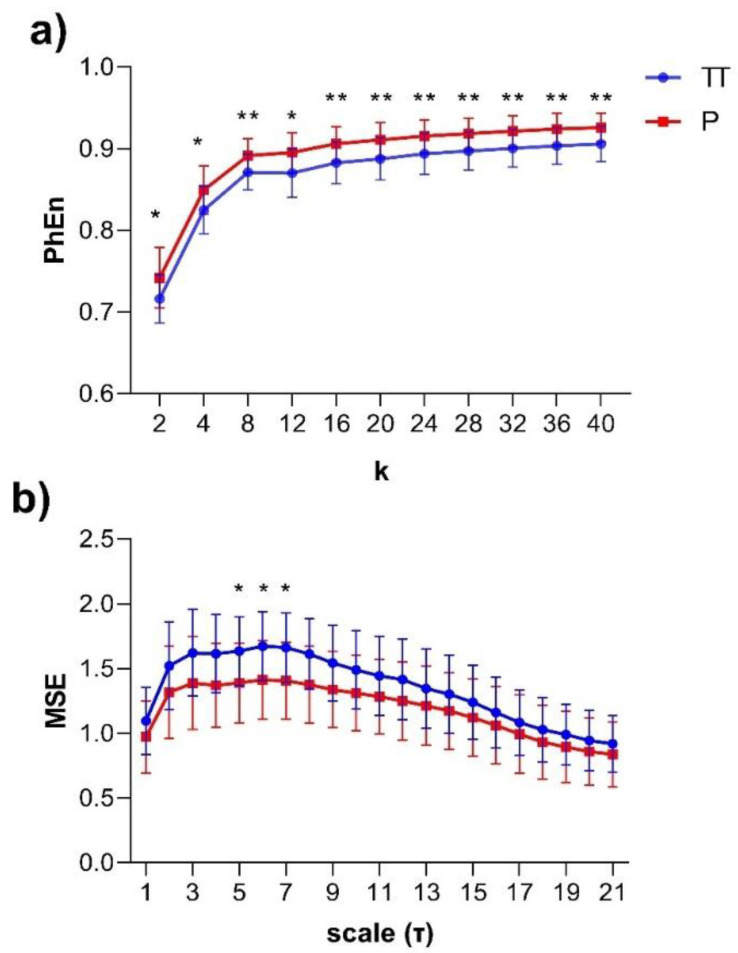
Figure 4.
(a) Mean values ± SD of the Phase Entropy (PhEn) for the range of the longitudinal electrohysterogram (whole EHG) time series of 24 pregnant women in two different stages: third trimester of pregnancy (TT, continuous blue line, from 35 to 38 weeks of pregnancy) and active parturition at term (P, continuous red line, >39 weeks of pregnancy); (b) mean values ± SD of the Multiscale Entropy (MSE) for 21 scales (τ) with the Sample Entropy (SampEn) estimator applied to EHG at TT and P. * p < 0.05 between TT vs. P and ** p < 0.01 between TT vs. P according to the Bonferroni post hoc test.

