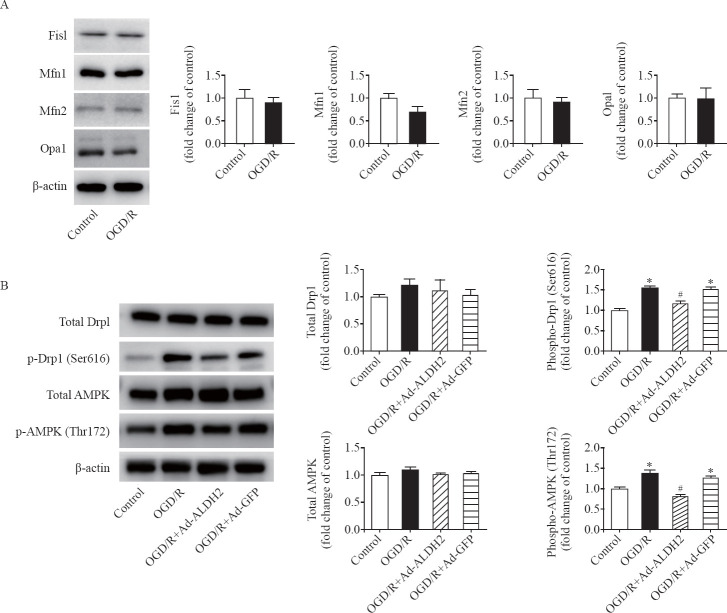
Figure 3.
ALDH2 suppressed Drp1 phosphorylation at Ser616 but not affected the expression levels of mitochondrial dynamics-regulating proteins. A: representative immunoblots and quantification of the expression levels of Fis1, Mfn1, Mfn2, and Opa1 in the control group and the OGD/R group; B: representative immunoblots and quantification of levels of total Drp1, phosphorylated Drp1 (p-Drp1) at Ser616, total AMPK, and phosphorylated AMPK (p-AMPK) at Thr172 in the control group, the OGD/R group, the OGD/R+Ad-ALDH2 group, and the OGD/R+Ad-GFP group; data are mean±standard error of mean (SEM); *P<0.05 vs. control group; #P<0.05 vs. OGD/R group.

