Fig. 3.
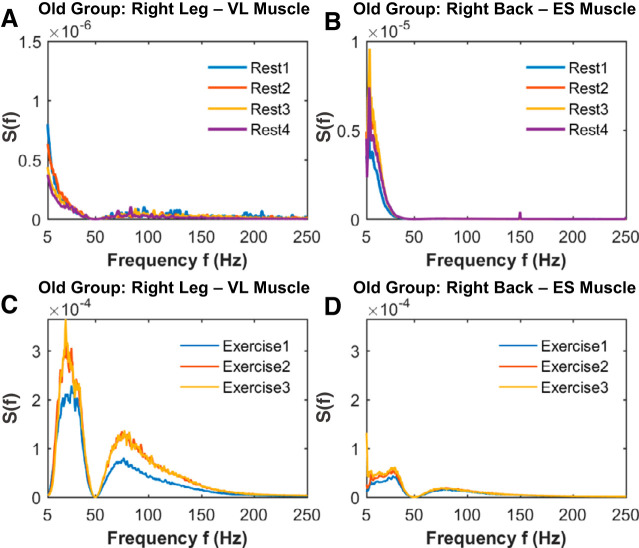
Leg and back muscle spectral power density profiles and their evolution across rest and exercise segments in old subjects. Group average spectral power S(f) distribution curves for the right leg vastus lateralis (VL) muscle and right back erector spinae (ES) muscle for consecutive rest (A and B) and exercise (C and D) segments of squat tests (see methods). For the leg muscle, a similar response to rest (B) and exercise (D), with similar spectral power evolution with accumulated fatigue, is observed in the old subjects compared with the young group shown in Fig. 2. In contrast, the back muscle exhibits a more reduced spectral response to rest (B) and exercise (D) and fatigue in old subjects compared with the young group. Electromyographical (EMG) signal preprocessing, spectral power calculation, and group averaging are performed as in Fig. 2 (see methods). Results for the left leg and left back muscle are consistent with the old group averaged results shown for the right leg and right back muscle in Fig. 2.

