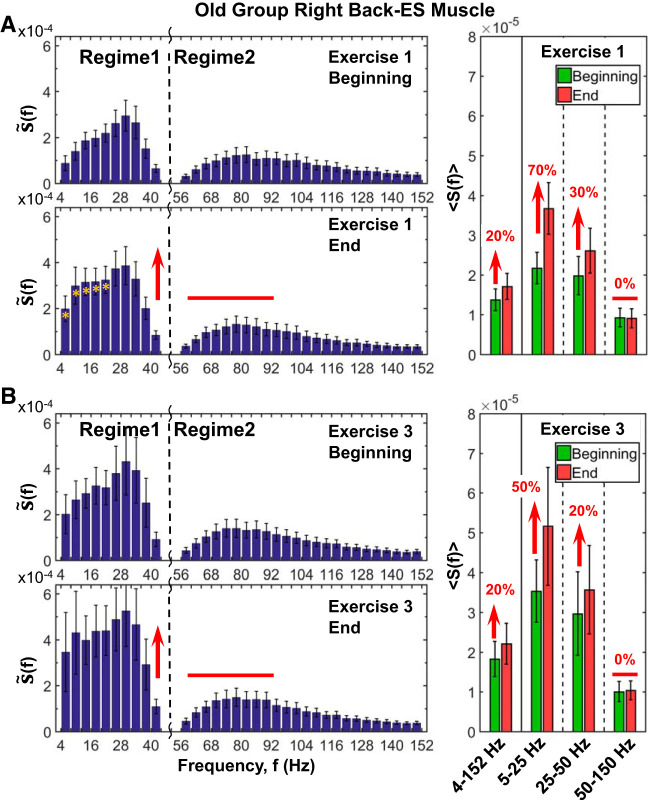
Fig. 10.
Effects of aging on back muscle spectral power response to accumulated fatigue at intermediate time scales during exercise and to residual fatigue at large time scales across consecutive exercise segments. Group average results for old subjects shown are obtained following the same experimental protocol, data processing, analysis procedure, and statistical tests as shown for the group of young subjects in Fig. 8 (see methods). Error bars indicate SE. Yellow stars at left indicate the frequency bands, with statistically significant differences in spectral power between beginning and end. A: detailed analysis of the contribution of different frequency bands to the right back muscle [erector spinae (ES)] spectral power shows S(f) profile shape and profile evolution during exercise that are consistently similar for individual subjects in both old (A) and young (Fig. 8A) groups. The back muscle spectral power profile exhibits 2 distinct frequency regimes with 1) different starting levels of power at the beginning of exercise, where regime 1 of low (5–25 Hz) and intermediate (25–50 Hz) frequencies has higher power (A, right) compared with regime 2 of high (50–150 Hz) frequencies, and 2) with different patterns of evolution in response to accumulation of fatigue with progression of exercise, where the power in regime 1 significantly increases (Student’s t test P < 0.01), whereas regime 2 remains unchanged (Student’s t test P = 0.7). The spectral power profile of the back muscle and its evolution with fatigue in the old group (A) are consistent with the young subjects in Fig. 8, indicating universality in myoelectrical activation during exercise. Note that the spectral power increase in regime 1 at the end of exercise 1 is less pronounced in old subjects (70% increase for 5–25 Hz and 30% for 25–50 Hz; A, right; Student’s t test, P < 0.01) compared with young subjects (140% increase for 5–25 Hz and 70% for 25–50 Hz; Fig. 8A, right panel; Wilcoxon matched-pairs test P < 0.002), indicating reduced response of back muscle activation in old subjects with accumulation of fatigue at intermediate time scales within an exercise. B: spectral power profile characteristics with 2 distinct frequency regimes and their evolution with fatigue in exercise 3 for the old group. S(f) behavior during exercise 3 is similar to exercise 1. Spectral power in regime 1 at the beginning of exercise 3 is significantly higher compared with exercise 1 (65% increase; Student’s t test, P < 0.04) due to residual fatigue from exercise 1 and exercise 2. Note that the 65% elevation in spectral power of regime 1 due to residual fatigue at the beginning of exercise 3 compared with the beginning of exercise 1 is less pronounced for the old group than for the young subjects (100% increase; Student’s t test, P < 0.04; see Fig. 8B, right), indicating reduced back muscle response to residual fatigue in old subjects. In contrast, the spectral power level in regime 2 at the beginning of exercise 3 does not increase compared with the beginning of exercise 1, indicating differentiated response of frequency regimes to residual fatigue that reflects specific back muscle fibers composition. As in exercise 1, there is a markedly different response of regime 1 and regime 2 to accumulation of fatigue during exercise 3 with significant increase in power of regime 1 from beginning to end of exercise (Student’s t test P < 0.05) and no change in the power of regime 2. However, the increase in regime 1 power during exercise 3 is less pronounced compared with exercise 1 (50% in the 5- to 25-Hz and 20% in the 25- to 50-Hz bands in exercise 3 compared with 70% and 30% correspondingly in exercise 1 for old subjects; A and B, right), indicating reduced back muscle response to accumulation of fatigue during exercise 3 due to the existing residual fatigue from exercises 1 and 2. Same effect on spectral power response in regime 1 (but with a larger amplitude) is also observed for young subjects with 80% (5–25 Hz) and 40% (25–50 Hz) increase in exercise 3 compared with 140% and 70%, respectively, in exercise 1 (Fig. 8 A and B, right). In addition to this muscle type differentiation based on aging effect, the results in A and B show a remarkable dissociation in response to fatigue of muscle fiber within the back muscle, as represented by different frequency bands; whereas there is a clear response to both accumulated and residual fatigue in regime 1, there is no change in frequency regime 2 (a behavior observed for both young and old subjects).

