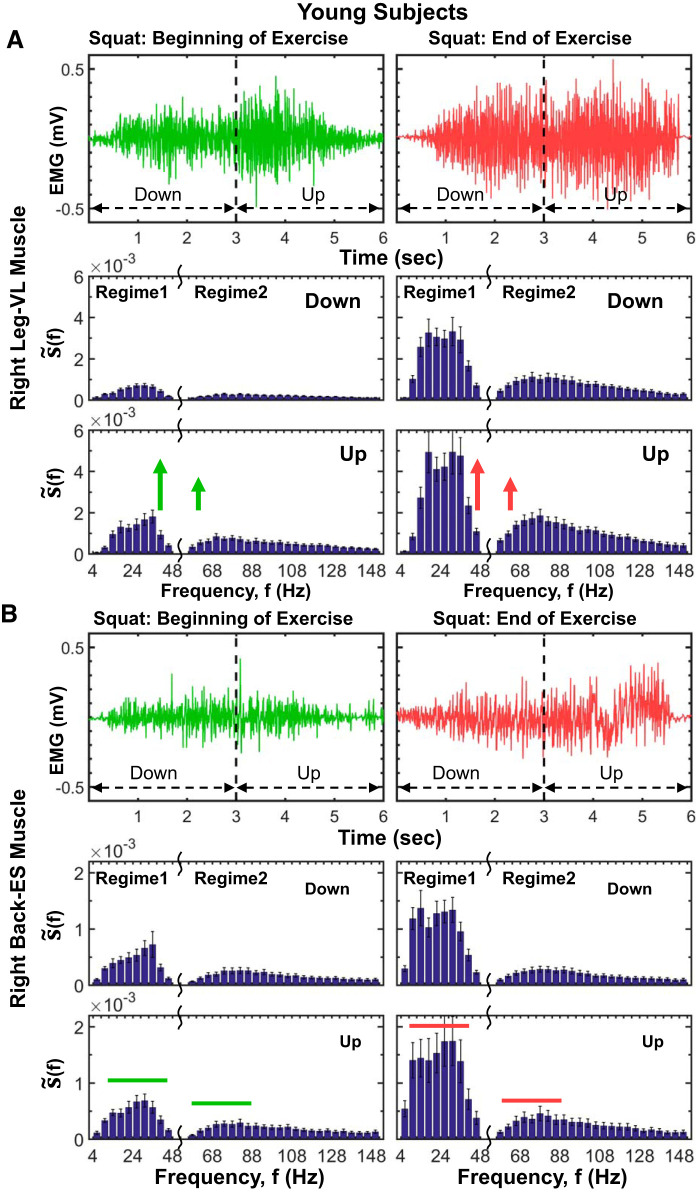
Fig. 11.
Leg and back muscle profiles in myoelectrical activity and spectral power at short time scales of a single squat movement and response to accumulated fatigue during exercise. A, top: myoelectrical activity profiles of right leg muscle [vastus lateralis (VL)] for the down and up phases of a single squat at the beginning and end of exercise 1 (see methods) for a representative young subject. Whereas at the beginning of exercise the EMG amplitude clearly increases with transition from down to up phase within a squat, leading to a bimodal profile, with progression of exercise the amplitude in both squat phases increases due to fatigue accumulation, and the transition from down to up phase in each squat becomes less pronounced. A, bottom: detailed leg muscle spectral profile (f) (presented in frequency bands of 4 Hz; see methods) and its evolution at short time scales from down to up phase within a squat at the beginning (left) and end (right) of exercise 1. Shown is the group average for all young subjects, where the spectral profile of each subject is derived from 5 separate squat movements at the beginning and end of exercise 1 (methods). Error bars in plots represent the group average SE. As for intermediate and large time scales, the leg muscle spectral profile is characterized by 2 distinct frequency regimes: regime 1 of low- (5–25 Hz) and intermediate-frequency (25–50 Hz) bands and regime 2 of high-frequency (50–150 Hz) band, with higher concentration of spectral power in regime 1 during the down phase and larger increase of spectral power in regime 1 compared with regime 2 in the up phase of the squat (A, bottom left). This evolution in spectral power profile with down/up transition within a single squat is consistently observed across subjects in the young group and shows a differentiated response of distinct leg muscle fibers represented by different frequency bands, where slow muscle fiber (regime 1) generates the dominant contribution to the spectral power increase in the up phase, reflecting specific role of different muscle fibers during lengthening (down phase) and shortening (up phase) muscle contractions. This characteristic spectral profile and its down/up phase transition is robust, as it is present for consecutive squat movements, albeit with increasing level of total spectral power in response to accumulated fatigue at the end of the exercise (A, bottom right). Notably, the leg muscle spectral profile and its evolution observed at short time scales within a single squat movement are also observed at intermediate time scales during separate exercise segments (Figs. 7 and 9) and at large time scales of consecutive exercise segments (Fig. 5B). B, top: myoelectrical activity of right back erector spinae (ES) exhibits an electromyographical (EMG) amplitude profile that is unimodal, with no down/up transition in squats at the beginning and end of exercise, in contrast to the bimodal amplitude profile of the right leg VL muscle (A, top). B, bottom: back muscle spectral power profiles for the down and up phases of squat movements at the beginning of exercise and spectral power evolution in response to fatigue at the end of exercise. Same protocol, data analysis, and group averaging procedures are performed as in A. As the leg muscle in A, the spectral profile of the back muscle is characterized with 2 distinct frequency regimes with a similar effect of fatigue accumulation, represented by an elevated level of total spectral power at the end of exercise. However, in contrast to the leg muscle, the back muscle spectral power does not increase with transition from the down to up phase of the squat. Episodes of increase in the back muscle spectral power with down/up transition within each squat at both the beginning and end of exercise, as well as the smaller rate of increase in total power with accumulation of fatigue at the end of exercise, reflect the secondary role back muscle plays in squat movements compared with leg muscle. Our findings for left leg (VL) and left back (ES) muscles (not shown here) are consistent with the results shown in A and B.

