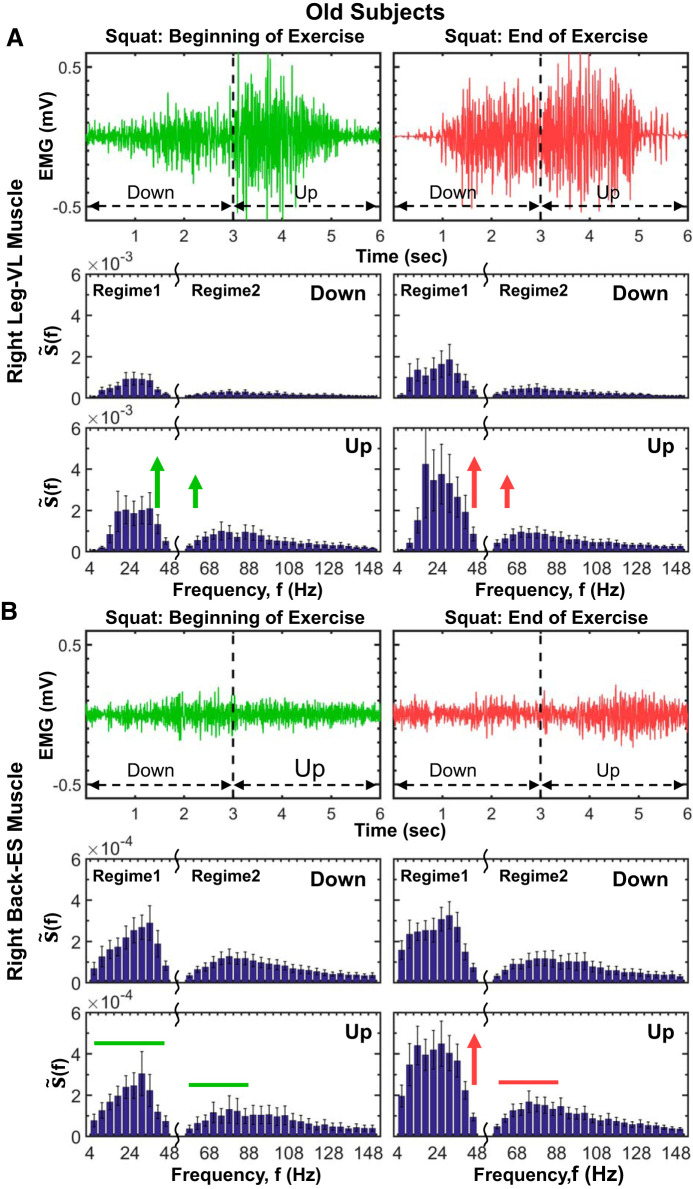
Fig. 12.
Aging effects on leg and back muscle myoelectrical activity and evolution of spectral power profiles at short time scales of a single squat. Myoelectrical activity profiles of a single squat movement (down and up phase) of a representative old subject for the right leg muscle [vastus lateralis (VL); A, top] and the right back muscle [erector spinae (ES); B, top] at the beginning and end of an exercise segment (see methods). The leg muscle myoelectrical activity during a single squat exhibits a bimodal profile, with lower EMG amplitude during the down squat phase, transition to a higher amplitude during the up phase, and significant increase in the electromyographical (EMG) amplitude of the entire squat movement with progression of exercise due to accumulated fatigue, the same general behavior as observed for the young group in Fig. 11. In contrast to the leg, the back muscle EMG squat profile is unimodal, with no difference in the EMG amplitude between the down and up squat phase, and less pronounced increase in the EMG amplitude with accumulation of fatigue at the end of exercise. Note that these characteristics of the leg and back muscle EMG amplitude profiles during squat movements (i.e., bimodal vs. unimodal EMG profiles) and how the EMG profiles change with progression of exercise are consistently observed for both old (A, top, and B, top) as well as for young subjects (Fig. 11), indicating strong association between the EMG amplitude profile and muscle type. The spectral power profile of the leg muscle (VL) for old subjects is characterized by 2 frequency regimes during both down and up squat phases, with a transition to higher spectral power during the up phase (A, bottom), consistent with the young group (Fig. 11). With progression of exercise, total power increases during both down and up phases, preserving the general shape of the spectral profile (A, bottom), an effect of accumulation of fatigue that is less pronounced for the down phase in old subjects (∼80% increase in down phase power from beginning to end of exercise; Wilcoxon matched-pairs test, P < 0.05) compared with young subjects (∼300% increase in down phase power from beginning to end of exercise; Wilcoxon matched-pairs test P < 0.01; see Fig. 11A), that can be related to an increase in connective tissue in the muscle due to aging (see Leg and Back Muscle Myoelectrical Activity and Spectral Power Profiles at Short Time Scales of a Single Squat Movement for physiological interpretation). Similarly to the right leg VL muscle, the spectral profile of the right back ES muscle exhibits 2 frequency regimes with higher concentrations of power in regime 1, but without an increase in spectral power with transition from down to up squat phase (B, bottom), a behavior consistently observed also in young subjects for the back muscle (Fig. 11B). In contrast to the young group (Fig. 11B, bottom), the down phase of the back muscle spectral power in old subjects does not change from beginning to end of exercise, indicating an aging effect of reduced back muscle activation in response to fatigue that can be attributed to increased connective tissue in the muscle (same aging effect, but less pronounced, is present for the leg muscle; see A, bottom, and Leg and Back Muscle Myoelectrical Activity and Spectral Power Profiles at Short Time Scales of a Single Squat Movement). Note the dramatic decline (∼1 decade) in the back muscle total spectral power of a single squat in old subjects compared with the young, indicating a reduction in back muscle mass as a result of sarcopenia. Same protocol, data analysis, and group averaging procedures are performed for the old subjects in A and B as for the young group in Fig. 11. Results for the left leg and left back muscle (not shown) are consistent with the results for the right leg and right back muscle shown.

