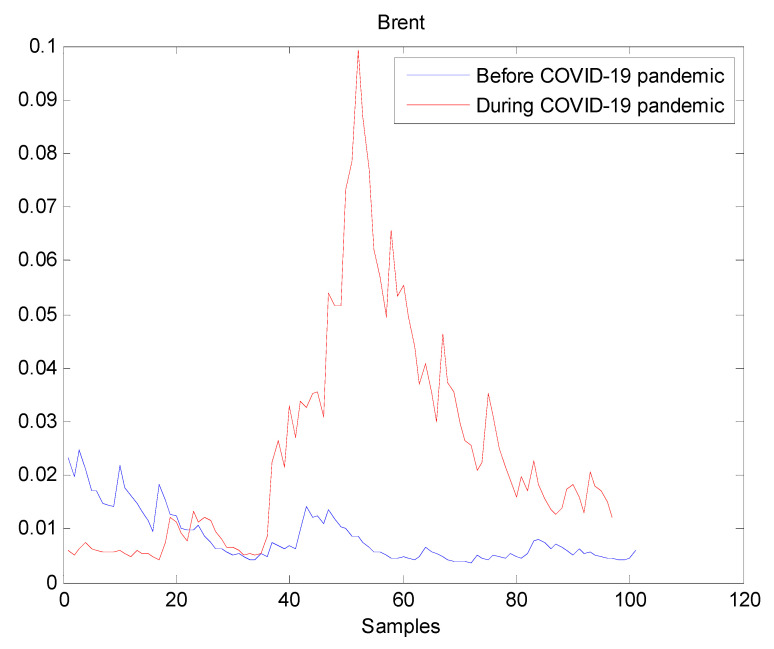
Figure 6.
Plot of volatility dynamics of Brent market. The pre-pandemic period spans 1 August 2019 to 31 December 2019 and the pandemic period from 2 January 2020 to 26 May 2020. The behavior of Brent volatility is decreasing during the pre- pandemic period. However, there are many large peaks in Brent volatility during the pandemic. It indicates that Brent volatility has increased during the pandemic, thereby the COVID-19 pandemic seriously affected Brent volatility.

