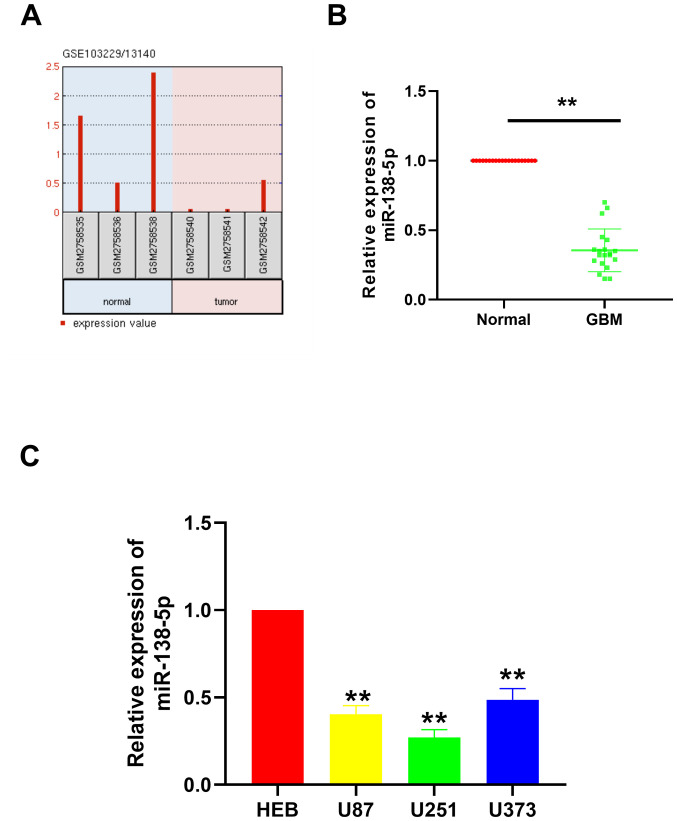
Figure 1.
miR-138-5p expression levels in GBM tissues and cell lines. (A) GEO2R analysis of the GEO datasets GSE103229 and GSE13140 indicated that the expression levels of miR-138-5p in the GBM tissues were downregulated compared with the normal tissues. (B) Relative miR-138-5p expression levels in 20 pairs of GBM tissues and adjacent normal tissues were analyzed using RT-qPCR. **P<0.01. (C) Relative miR-138-5p expression levels in GBM cell lines (U87, U251 and U373) compared with a normal glial cell line, HEB, were analyzed using RT-qPCR. **P<0.01 vs. HEB. A paired Student's t-test was used in part (B) and a one-way ANOVA followed by a Tukey's post hoc test was used in part (C) miR, microRNA; GBM, glioblastoma; RT-qPCR, reverse transcription-quantitative PCR.

