
Figure II.
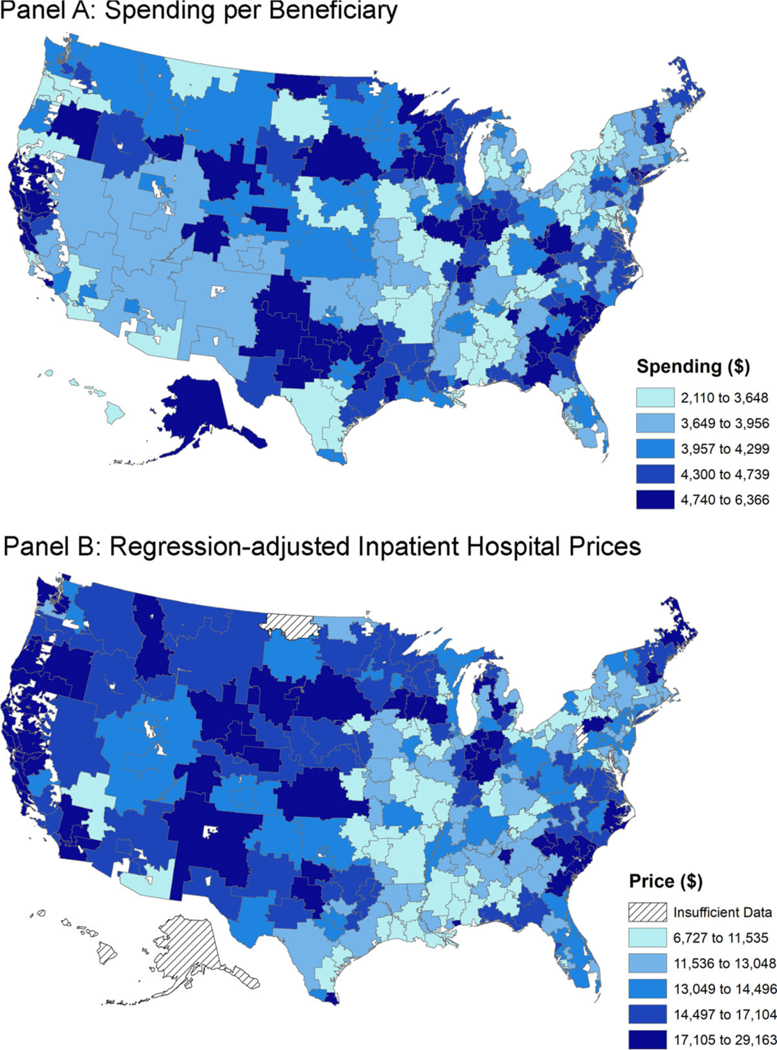
Total Private Spending by HRR, 2011
Panel A captures risk-adjusted spending per beneficiary by HRR using data from 2011. Each bin captures a quintile of spending per beneficiary. The data are drawn from the spending sample. Spending per beneficiary is risk-adjusted for age and sex. Panel B captures HRR-level average hospital regression-adjusted inpatient prices that are risk-adjusted for DRG, age, and sex, and weighted by hospital activity. In Online Appendix Figure VII, we present this map normalized using the Medicare wage-index to control for local wage costs across the United States. Thatched regions are areas where we do not have sufficient data to calculate prices.