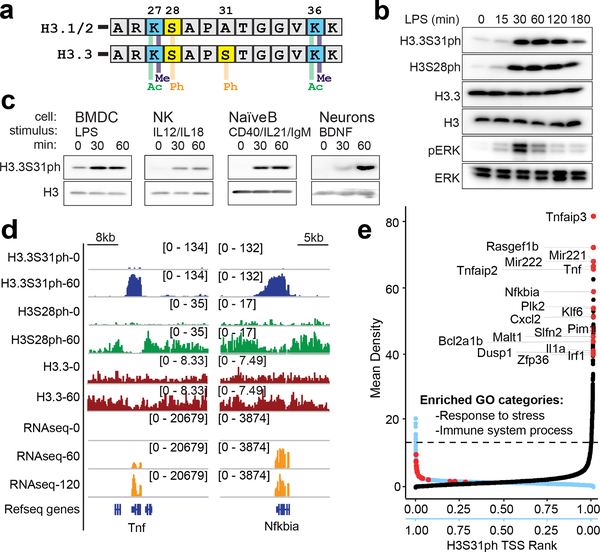
Figure 1: Histone H3 variant, H3.3, is phosphorylated at stimulation-induced genes during the macrophage response to pathogen sensing.
(A) Histone H3 sequence comparison between “canonical” H3.1/2 and variant H3.3 amino-terminal tails (residues 25–37), with key histone modifications labeled. (B) Western blot time course analysis of phospho-proteins, H3.3S31ph, H3S28ph, pERK in BMDM response to LPS; total H3, H3.3, and Erk as loading controls. (C) Western blot analysis of H3.3S31ph in bone marrow derived dendritic cells (BMDC), natural killer cells (NK), naïve B cells and neurons both in resting conditions and after treatment with relevant stimuli. (D) RNAseq tracks and H3.3, H3.3S31ph, and H3S28ph ChIPseq tracks in resting and stimulated BMDM at the Tnf and Nfkbia loci. (E) Dual rank order plot of H3.3S31ph ChIP signal density at all genes (TSS-TES) in resting macrophages (ranked in reverse order, right to left, blue X-axis) and stimulated (60’) macrophages (ranked left to right, black X-axis). Dotted line represents the top 1% threshold in stimulated macrophages. Red dots represent top stimulation-induced genes (FDR<0.05, fold change >2 between 0’ and 60’) among the top 0.2% of genes by H3.3S31ph ChIP density and are labeled in the 60’ data. Figure 1B-C are representative of 3 or more experiments.

