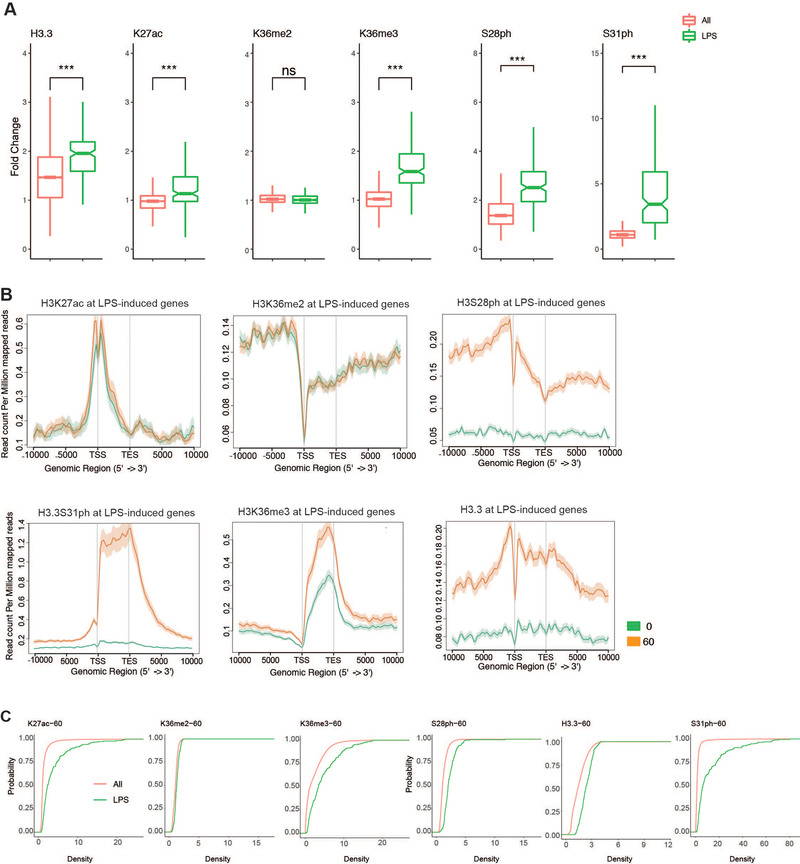
Extended Data Figure 6: H3.3S31ph and other H3 PTMs at response genes and after stimulation.
(A) Additional examples (H3K27ac and H3S28ph) of ChIP-seq density fold change comparing the set of all genes (All) to RNAseq defined LPS-stimulated genes to RNAseq defined LPS-stimulated genes (LPS) as shown in Figure 3B for (H3.3, K36me2, K36me3, S31ph) (B) Average gene profiles (in addition to H3.3S31ph and H3K36me3 in Figure 3, shown here are H3K27ac H3K36me2, H3S28ph and H3.3) comparing RNAseq defined LPS-induced genes before and after stimulation. (C) Cumulative distribution function (CDF) plots for H3K27ac H3K36me2, H3K36me3, H3S28ph, H3.3 and H3.3S31ph reveal selective role of H3.3S31ph compared with ubiquitous role of H3K36me3. ***<0.0001 by Student’s t-test.

