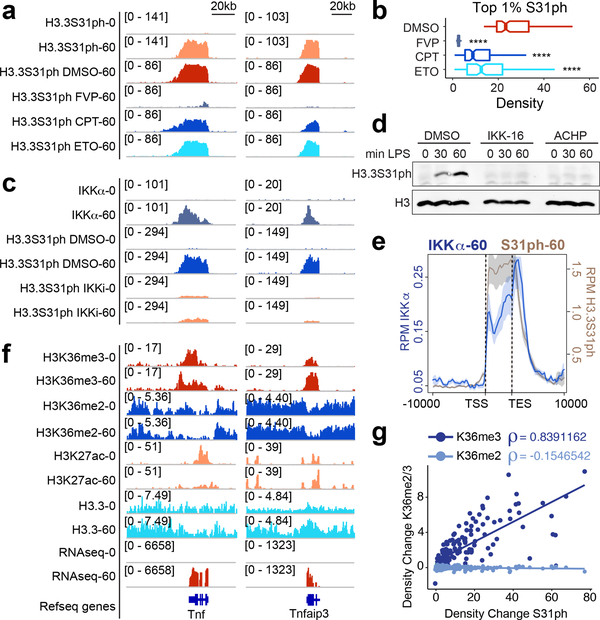
Figure 2: H3.3S31 is co-transcriptionally phosphorylated by IKKα, deposited in the gene-body of response genes, and corresponds with H3K36me3.
ChIPseq tracks of H3.3S31ph at Tnf and Tnfaip3 (A), and read densities of top 1% H3.3S31ph target genes (B) in resting and LPS-stimulated BMDM after pre-treatment with DMSO, flavopiridol (FVP), camptothecin (CPT) and etoposide (ETO). ****, p<0.0001; Student’s t-test. (C) ChIPseq tracks of IKKα and H3.3S31ph at Tnf and Tnfaip3 after pre-treatments with DMSO and the IKK inhibitor IKK-16 (1.5 μM). (D) Western blot analysis of H3.3S31ph in resting and LPS-stimulated BMDM after pre-treatment with DMSO and the IKK inhibitors IKK-16 (1.5 μM) and ACHP (10 μM). (E) ChIPseq average profiles for H3.3S31ph and IKKα of RNAseq defined LPS-induced genes after 60 min of LPS stimulation. (F) ChIPseq tracks of H3K36me3, H3K36me2, H3K27ac, and H3.3, and RNAseq in resting and LPS-stimulated BMDM at Tnf and Tnfaip3. Additional genes and controls are shown in fig. S3. (G) Correlation plot showing absolute change (average read density 60’ - 0’ after LPS-stimulation) of H3K36me3 and H3K36me2 association with H3.3S31ph absolute change (average read density 60 – 0). Spearman’s rank correlation coefficient shown.

