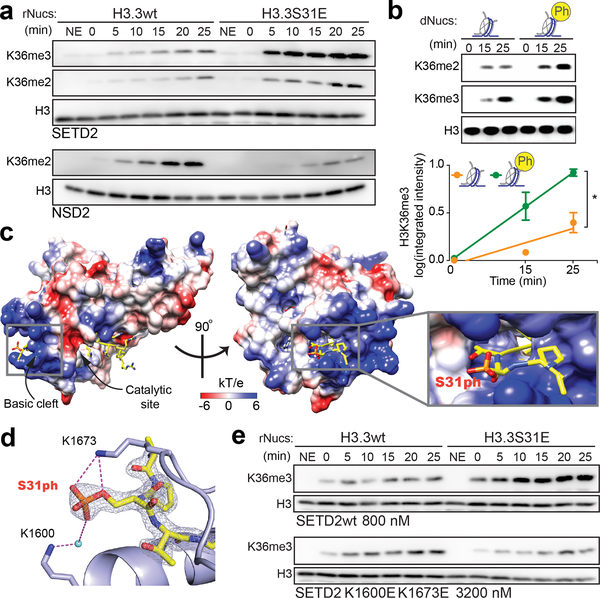
Figure 3. The H3K36me3 methyltransferase SETD2 is stimulated by H3.3S31ph.
(A) Western blot analysis for H3K36me2, H3K36me3, and H3 in histone methyltransferase (HMT) assays with SETD2 SET-domain and full-length NSD2 enzymes on unmodified H3.3 (H3.3wt) and H3.3S31E recombinant nucleosomes (rNucs). (NSD2 did not show any signal for H3K36me3) (NE, No Enzyme). (B) Representative western blot (above) and quantitative measurements of 3 independent experiments (integrated fluorescence intensity) (below) of SETD2 SET-domain HMT assays on unmodified and H3.3S31ph designer nucleosomes (dNucs). *, p<0.05; Student’s t-test. Error bars in (B) represent the range of three independent experiments. (C) Crystal structure of SETD2-H3.3S31phK36M complex. SETD2 is presented as electrostatic potential surface. Electrostatic potential is expressed as a spectrum ranging from −6 kT/e (red) to +6 kT/e (blue). H3.3 peptide is shown as yellow sticks with S31 phosphate group labeled. (D) Interaction of the H3.3S31ph phosphate group with K1673 and K1600 of SETD2. The salt bridge bonding and water mediated hydrogen bonding are shown as magenta dashed lines. The peptide is shown as yellow sticks covered by the simulated annealing 2Fo–Fc omit map contoured at the 2.0 σ level. The water molecule is shown as a cyan sphere. (E) Western blot analysis for H3K36me3 in HMT assays with SETD2 SET-domain wild type (wt), and K1600E,K1673E double mutant on H3.3wt and H3.3S31E rNucs. As the overall activity of the mutant enzymes is reduced, enzyme concentration was titrated to best visualize the ratio of H3.3wt to H3.3S31E activity.

