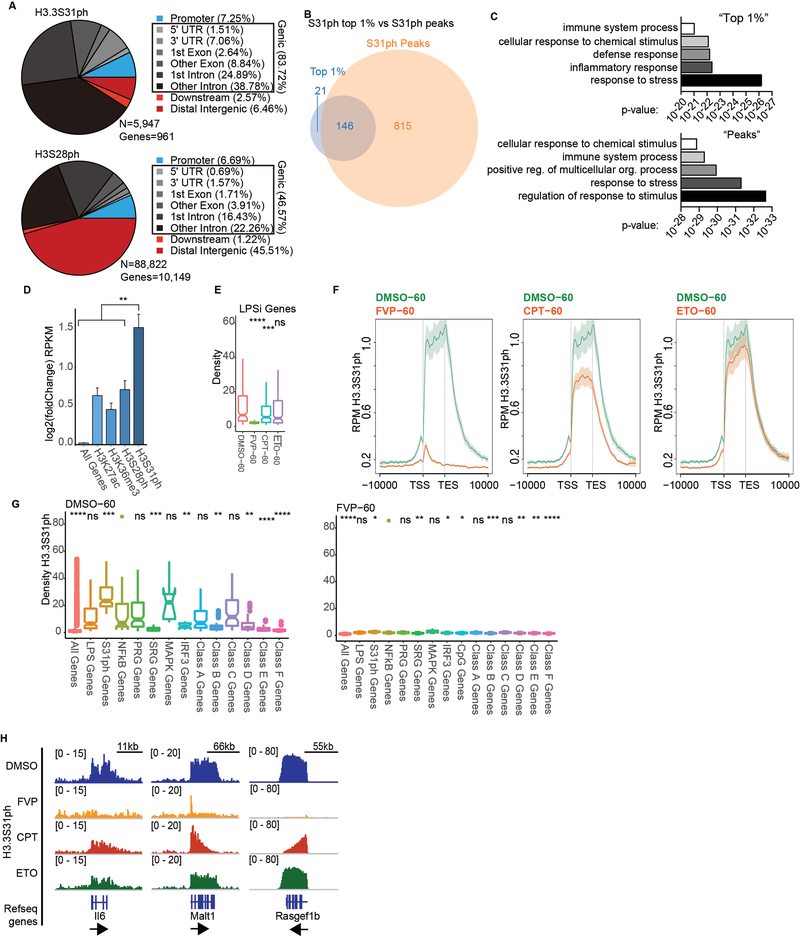
Extended Data Figure 4: H3.3S31ph requires transcription elongation.
(A) Comparative pie charts showing percentage of ChIPseq reads for H3.3S31ph (top) and H3S28ph (bottom) in the indicated genomic regions. We called H3.3S31ph peaks and find that they associated with only 961 genes with 83.72% of peaks falling within gene bodies. By comparison, the majority of H3S28ph peaks fall in promoters and intergenic regions. Given the selective gene body localization of H3.3S31ph, we ranked all annotated genes in the genome by H3.3S31ph ChIP signal density (TSS-TES) in resting and stimulated macrophages. This analysis shows that many more genes acquire high-density H3.3S31ph upon stimulation compared with resting cells (Fig. 1e), which is consistent with our MS and other global analysis of H3.3S31ph levels. Additionally, several of the top ranked genes (note, by density, not fold change) are prominent LPS-induced genes, including Tnfaip3 (A20), Tnf, Il1a, and Plk2 (Fig. 1e), all among the top ranked peaks (Supplementary Table 2). (B) We defined a threshold for the top 1% of genes (genome wide) by H3.3S31ph TSS-TES density in stimulated macrophages (167 genes) and find considerable overlap with genes annotated to H3.3S31ph peaks (961 genes). (C) Comparison of gene ontology (GO) analysis for “top 1%” genes and “peak” genes reveals extensive similarities of these two independent analyses with 3 of the top 5 GO categories shared and reflecting the stimulation-induced nature of genes featuring H3.3S31ph: “response to stress”, “immune system process”, “cellular response to chemical stimulus” (Supplementary Table 3). (D) We compared the H3.3S31ph chromatin state to other “active” chromatin states including H3K27ac, H3K36me3, and H3S28ph as they relate to stimulation-induced gene expression. Our analysis reveals that genes with H3.3S31ph are highly enriched for stimulation-induced genes by RNAseq, especially primary response genes, NF-κB targets, and MAPK-dependent genes (Fig. 1I, Extended Data Fig. 4–6) (from Tong et al. Cell 2016; Bhatt et al. Cell 2012). (E) H3.3S31ph ChIPseq read densities of (left) LPS-induced genes and (right) top 1% H3.3S31ph target genes in LPS-stimulated BMDM (60’) after pre-treatment with FVP, CPT and ETO compared to DMSO treatment. For comparison with Fig. 2b. (F) ChIPseq average profiles of H3.3S31ph in LPS-stimulated BMDM after pre-treatment with either DMSO, FVP, CPT, or ETO. (G) Box plots showing H3.3S31ph ChIPseq read densities in LPS-stimulated BMDM (60’) after pre-treatment with DMSO (left) and FVP (right). Comparisons are made between NF-κB target genes and LPS-induced genes, top 1% of H3.3S31ph targets, primary (PRG) and secondary (SRG) response genes, MAPK and IRF3 dependent genes and different sub-groups of PRG (Classes A-D) and of SRG (Classes E-F) (from Bhatt et al. Cell 2012). (H) ChIP-Seq tracks of H3.3S31ph in LPS-stimulated macrophages (60’) after pretreatment with FVP, CPT, and ETO. To complement Fig. 2a.

