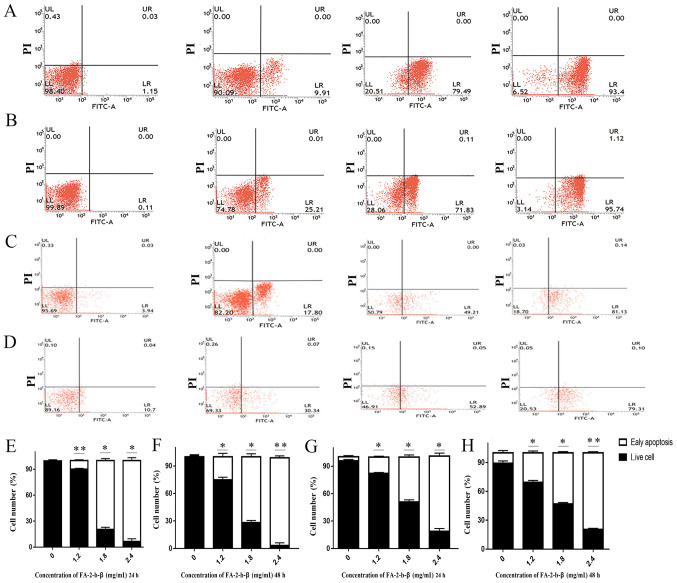
Figure 2.
Flow cytometry analysis reveals AbM increased the apoptotic K562 cells and primary CML BM cells percentages in a concentration-dependent manner. K562 cells and primary CML BM cells were treated with different concentrations of AbM (0, 1.2, 1,8 and 2.4 mg/ml). K562 cells treated with different concentrations of AbM for (A) 24 and (B) 48 h. Primary CML BM cells treated with different concentrations of AbM for (C) 24 and (D) 48 h. Quantification of K562 cells treated with different concentrations of AbM for (E) 24 and (F) 48 h. Quantification of primary CML BM cells treated with different concentrations of AbM for (G) 24 and (H) 48 h. Data shown are representative of three independent experiments with K562 cells and primary CML BM cells. Data are presented as the mean ± SD. *P<0.05; **P<0.01 vs. 0 mg/ml.

