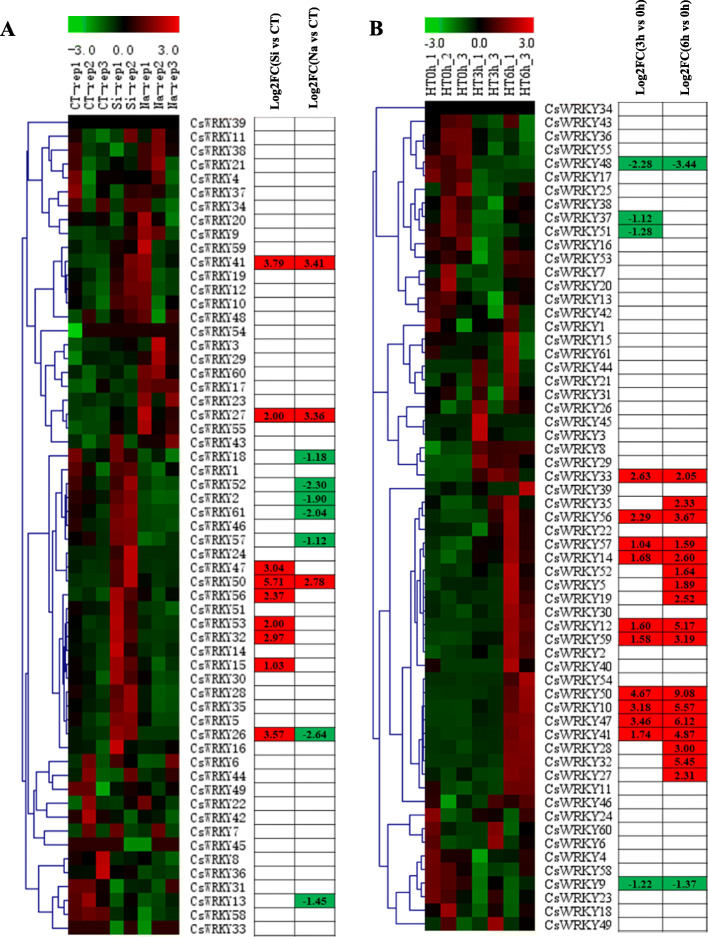
Fig. 8.
Expression profiles of CsWRKY genes in response to various abiotic stress treatments. The transcriptional levels of CsWRKY genes in response to salt (a) and heat (b) stresses were investigated based on a public transcriptome data [70] and transcriptome data that we performed, respectively. The genome-wide expression of CsWRKY genes under different treatments was shown on a heatmap using FPKM values, and the expression data were gene-wisely normalized by MeV software. -3.0 to 3.0 was artificially set with the color scale limits according to the normalized value. The color scale shows increasing expression levels from green to red. In the table, differentially expressed genes (DEGs) were highlighted by red (up-regulation) and green (down-regulation). FC, fold-change; CT, control; HT, heat treatment; HT0h = heat treatment for 0 h (hours); HT3h = heat treatment for 3 h; HT6h = heat treatment for 6 h

