
Figure 1.
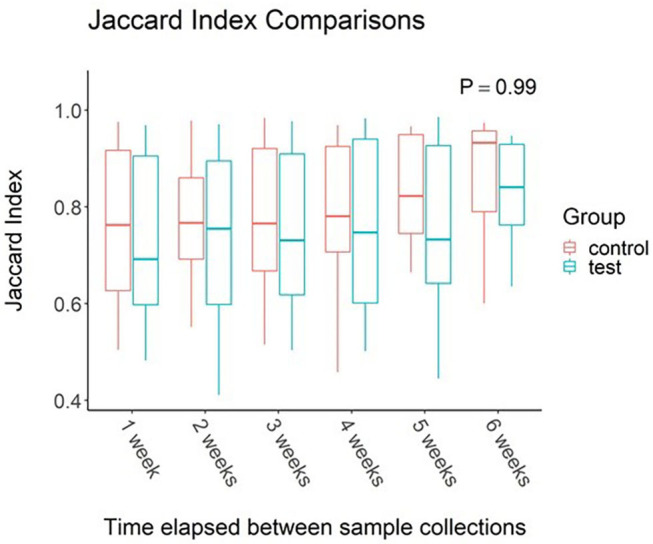
Impact of time elapsed on salivary microbiota for dogs administered oral probiotic vs. control. Jaccard index values were calculated between samples for each dog. Values were then grouped based on weeks elapsed between sample collections. Boxplots represent the distribution of Jaccard Index values when said number of weeks had elapsed between two samples. Upper and lower hinges of boxplots represent first and third quartiles. Upper whiskers extend from hinge to the largest value no further than 1.5 * IQR (inter-quartile range) of the hinge. Lower whiskers extend from the hinge to the smallest value at most 1.5 * IQR of the hinge. Middle line represents the median value.