Figure 3.
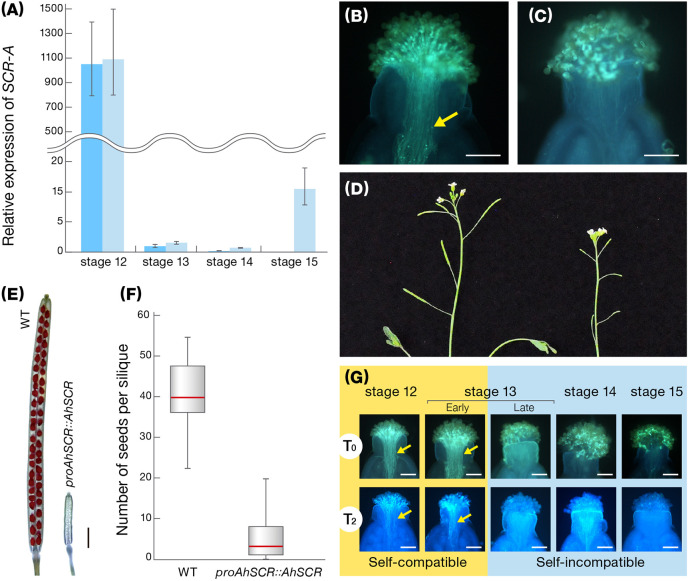
Characteristics of transgenic A. thaliana with a functional SCR-A. (A) Expression of SCR-A at flower developmental stages 12–15 in proAhSCR::AhSCR transgenic A. thaliana plants (light blue) and A. halleri W302 plants (blue). Relative gene expression was determined by qRT-PCR and expression levels of transcripts at each stage are shown relative to A. halleri W302 at stage 13 (set to value of 1). Data from 4 biological replicates are shown. Error bars indicate ± SD. (B) Pollen tubes accepted in the stigma of a selfed pistil of wild-type A. thaliana Old-1. Arrow indicates growing pollen tubes. Scale bar, 0.1 mm. (C) Pollen tubes inhibited on the stigma of a selfed pistil of proAhSCR::AhSCR transgenic A. thaliana plant. Scale bar, 0.1 mm. (D) Inflorescences of proAhSCR::AhSCR transgenic A. thaliana plant (right) and wild-type A. thaliana Old-1 (left). (E) Silique resulting from selfing of proAhSCR::AhSCR transgenic A. thaliana (right) and wild-type A. thaliana Old-1 (left). Scale bar, 1 mm. (F) Comparison of number of seeds per silique resulting from selfing of the proAhSCR::AhSCR transgenic A. thaliana plant and wild-type A. thaliana Old-1. Thirty siliques were examined from each plant. Red bars, gray boxes, and black whiskers represent the median, the interquartile range, and 1.5 times extension of the interquartile range, respectively. (G) Pollination phenotype in T0 and progeny plants (T2 shown as a representative of T2, T3, and T6 plants) of proAhSCR::AhSCR transgenic A. thaliana, with flower development stage. Arrows indicate growing pollen tubes. Scale bar, 0.1 mm.

