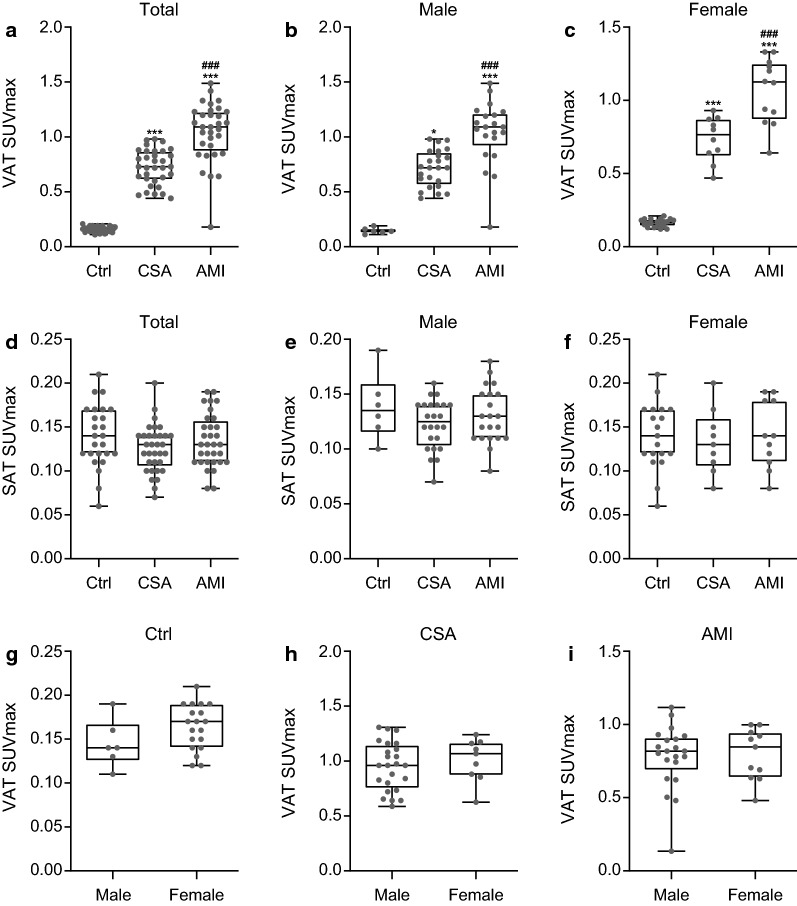
Fig. 2.
Comparison of VAT SUVmax and SAT SUVmax in total- (a, d), male- (b, e), and female participants (c, f), according to the severity of CAD. Comparison of VAT SUVmax between male- and female participants in Ctrl (g), CSA (h), and AMI (i) group. a, d; Ctrl, n = 25; CSA, n = 33; AMI, n = 32. Ctrl, control; SUVmax, maximum standardized uptake value; SAT, subcutaneous adipose tissue. P-values were determined using Kruskal–Wallis test with post hoc Dunn’s test. ***p < 0.001; vs. Ctrl, ### p < 0.001; vs. CSA. b, e; Ctrl, n = 6; CSA, n = 24; AMI, n = 21. P-values were determined using Kruskal–Wallis test with post hoc Dunn’s test. ***p < 0.001; vs. Ctrl, * p < 0.05; vs. Ctrl, ### p < 0.001; vs. CSA. c, f; Ctrl, n = 19; CSA, n = 9; AMI, n = 11. P-values were determined using one-way analysis of variance (ANOVA) with post hoc Tukey test. ***p < 0.001; vs. Ctrl, ### p < 0.001; vs. CSA. g; male, n = 6; female, n = 19. P-values were determined using Student’s t-test. h; male, n = 24; female, n = 9. P-values were determined using Student’s t-test. i; male, n = 21; female, n = 11. P-values were determined using Mann–Whitney U test

