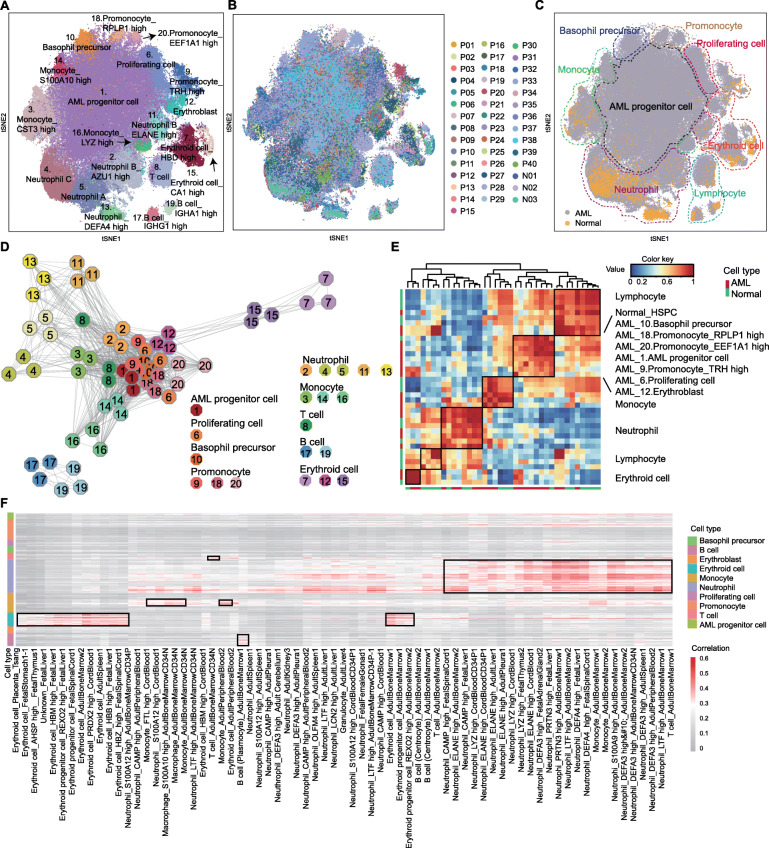
Fig. 2.
Identifying the progenitor cell cluster of de novo AMLs. a, b t-SNE analysis of AML and normal BMMCs. Twenty clusters, 40 patients, and 3 normal donors are labeled in different colors and numbers. c t-SNE analysis of BMMCs. AML and normal cells are labeled in different colors. Different cell types are surrounded by dotted lines. d Connection network map of the clusters. Each cluster is represented by three octagons. Clusters correspond to those in a. e Correlation matrix of clusters in normal and AML cells. Red and blue represent high and low correlations, respectively. The X- and Y-axis represent the AML and normal cell. f Single-cell blast results of AML cells. Each row represents cells in AML. Each column represents one cell type in HCL reference. The length of cell type bar represents the cluster number. Red and gray represent high and low correlations, respectively

