Fig. 5.
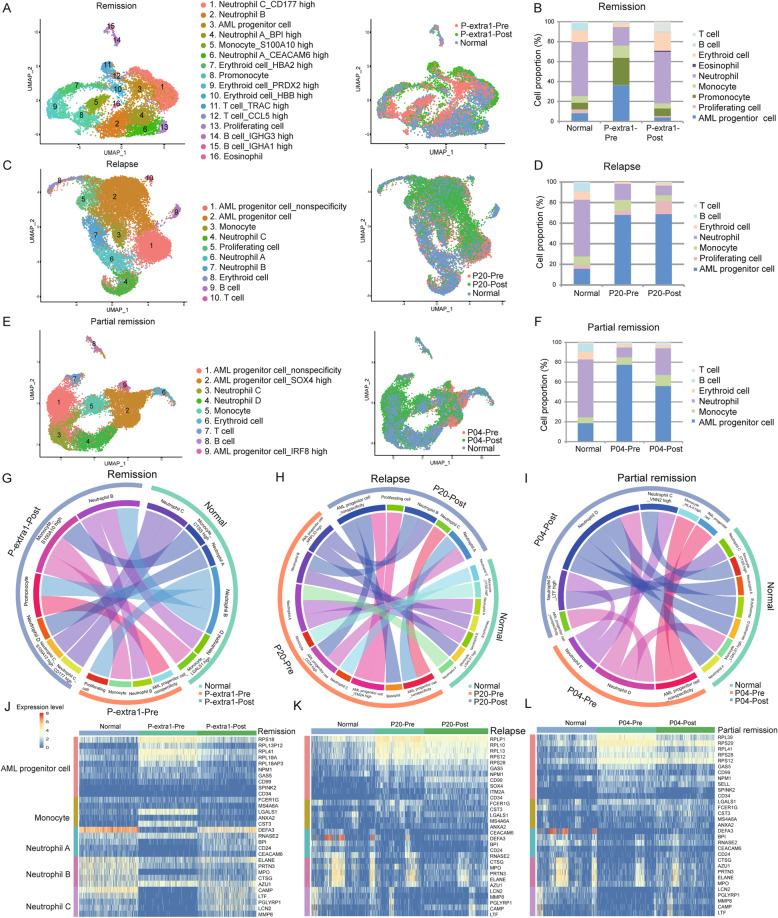
Clinical implication of AML progenitor cells from diagnosis to relapse. a, c, e UMAP analysis of normal and AML individuals before and after treatment regimen. The AML individuals are in remission (P-extra 1, a), relapse (P20, c), and partial remission (P04, e). The normal sample is N02. Colors represent clusters in left panels, and individuals in the right panels. b, d, f Relative proportion analysis of clusters in normal and AML individuals. Cell types are labeled in different colors. g–i Circos plots showing the correlation of clusters. The similar clusters are connected by lines. j–l Heatmap of differentially expressed marker genes. Each row represents marker genes of each cell type. Each column represents cells in different status. Red and yellow represents high expression level while blue represents low levels

