
FIGURE 1.
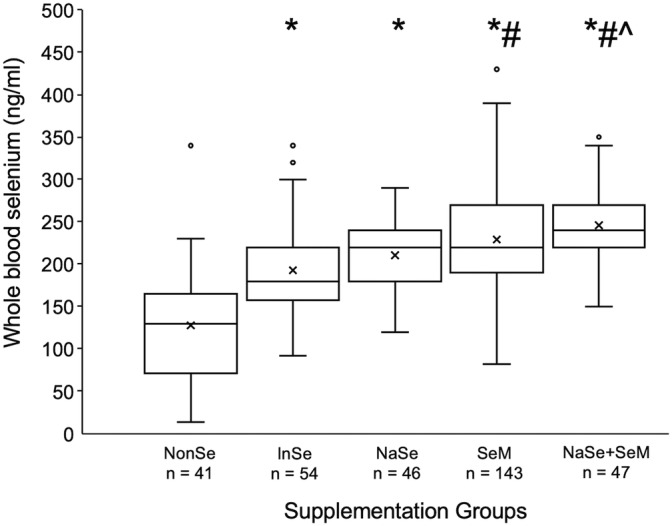
Box and whisker plot of whole blood selenium concentration versus supplementation groups; horses with no directed selenium supplementation, including 26 horses with access to a selenium‐containing salt block (NonSe), horses receiving some selenium but <1 mg daily (InSe), and horses receiving ≥1 mg of selenium per day, as either >90% sodium selenite (NaSe); >90% selenomethionine (SeM); or a combination of both at <90% each (SeM+NaSe). The box describes first, second (median) and third quartiles, “x” signifies the mean, whisker length is 1.5*IQR and dots are outliers. Number of horses included in each supplementation group is provided below the graph. Superscripts *, # and ^ indicate significant difference in whole blood selenium concentration from NonSe (P < .001), InSe (P < .001), and NaSe (P = .02) groups, respectively, via ordinary 1‐way ANOVA and Tukey's multiple comparison test