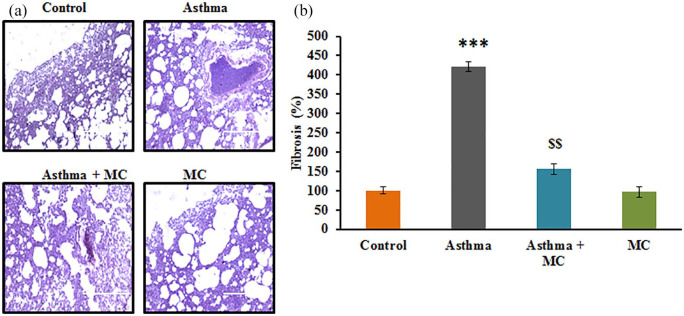
Figure 1.
(a) Lung tissue histology stained using hematoxylin and eosin stain. (b) The fibrosis score of the control and experimental group of rats. The details of staining and scoring were given in the methodology section. Values are expressed as mean ± standard error (SE) (n = 10). Statistical significance expressed as ***P < 0.001 compared to vehicle-treated controls; $$ P < 0.01 compared to asthma rats.

