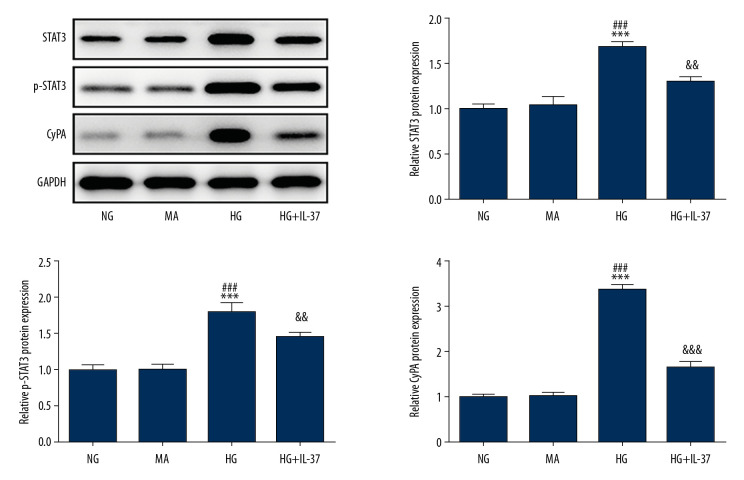
Figure 5.
The expression of STAT3/CypA in cells treated with IL-37. Western blot was used to detect the expression of STAT3, p-STAT3, and CypA in the cells. *** p<0.001 vs. NG; ### p<0.001 vs. MA; && p<0.01, &&& p<0.001 vs. HG. NG, normal glucose group (medium with 5.5 mM glucose); MA – mannitol-treated podocytes used as the osmotic pressure control group; HG – high-glucose group (medium with 30 mM glucose).

