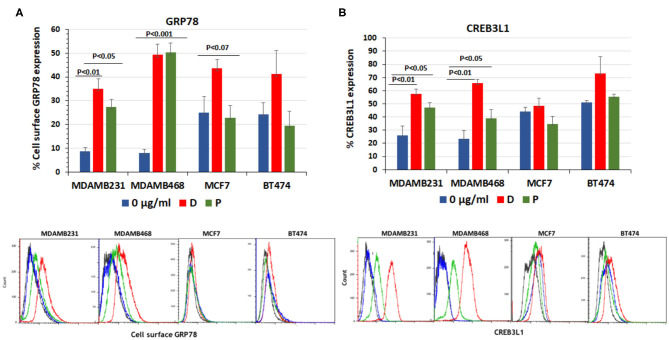
Figure 1.
Doxorubicin and paclitaxel increased cell surface GRP78 and CREB3L1 expression in TNBC cells. FACS analysis of cell surface following addition of doxorubicin (D) (0.01 μg/ml) and paclitaxel (P) (0.01 μg/ml) to MDAMB231, MDAMB468, MCF7, and BT474 cell lines: (A) GRP78, (B) CREB3L1. Representative FACS histograms are presented below the respective graphs. In blue- Control, in red-doxorubicin and in green- paclitaxel.

