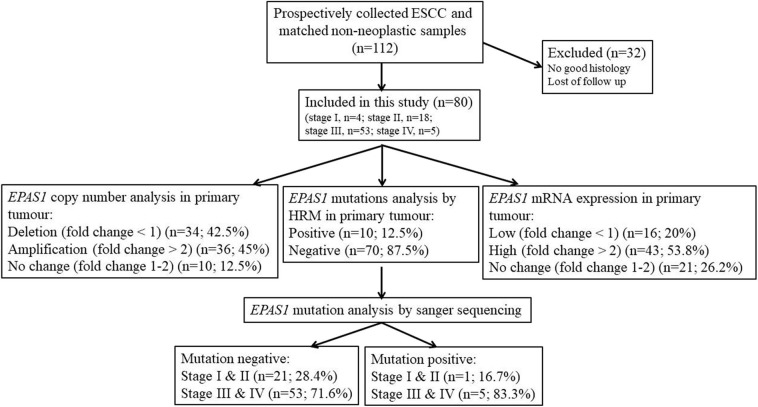
Figure 1.
Schematic representation of the methodological flow used for clinical samples analysis in the present study. Tissue samples with poor histology and loss of follow-up were excluded in the present study. Among the samples, 45% showed EPAS1 DNA amplification, whereas 42.5% showed EPAS1 DNA deletion. The rest of the samples (12.5%) showed no changes in EPAS1 DNA. In addition, 53.8% of samples showed high EPAS1 mRNA expression, and 16.2% of samples showed low EPAS1 mRNA expression, whereas 20% of samples did not show any changes in EPAS1 mRNA expression. Furthermore, 12.5% of samples showed EPAS1 mutations, and 87.5% of samples were mutation negative in the present study.

