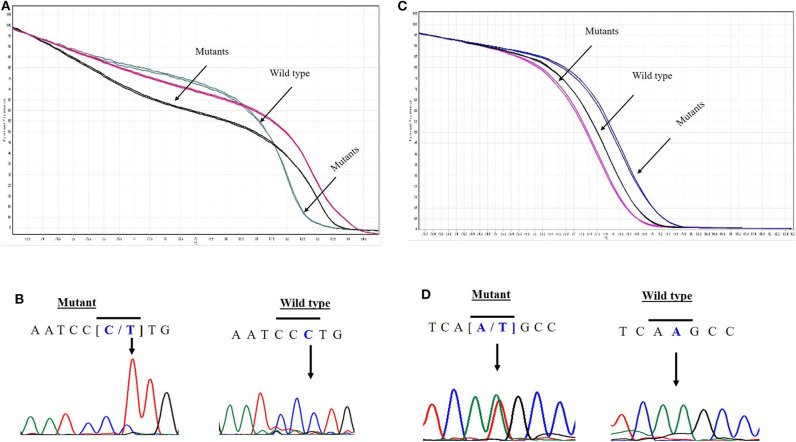
Figure 2.
Novel variants in EPAS1 detected in ESCC tissues. Comparison of HRM curve analysis and Sanger sequencing of the variants identified in patients with ESCC. Representative HRM curve (A) and chromatograph (B) for the synonymous mutation c.1084C>T (L362L). Representative HRM curve (C) and chromatograph (D) for the frameshift variant c.1091_1092insT (K364Nfs*12).

