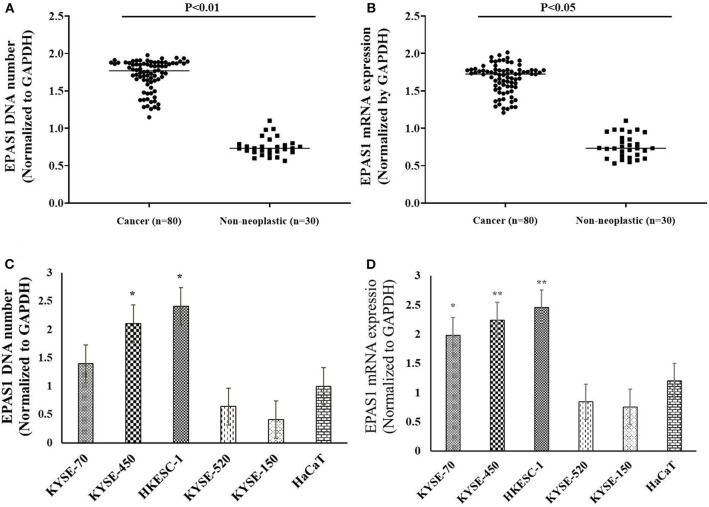
Figure 3.
EPAS1 DNA number and mRNA expression profile in patients with ESCC and cell lines. (A) Patients with ESCC exhibited significant amplifications of EPAS1 DNA when compared with noncancerous samples (p < 0.01). (B) Similarly, a significant overexpression of EPAS1 mRNA in ESCC was noted in comparison to that of noncancerous tissues (p < 0.05). (C) Cell lines showed higher or lower EPAS1 DNA number when compared to that of noncancerous keratinocyte (HaCaT) cells. (D) Higher or lower EPAS1 mRNA was noted in ESCC cancer cells when compared with nonneoplastic HaCaT cells. Results are shown as mean ± SD, and significance level was taken at p < 0.05. *p < 0.05, and **p < 0.01.

