Figure 5.
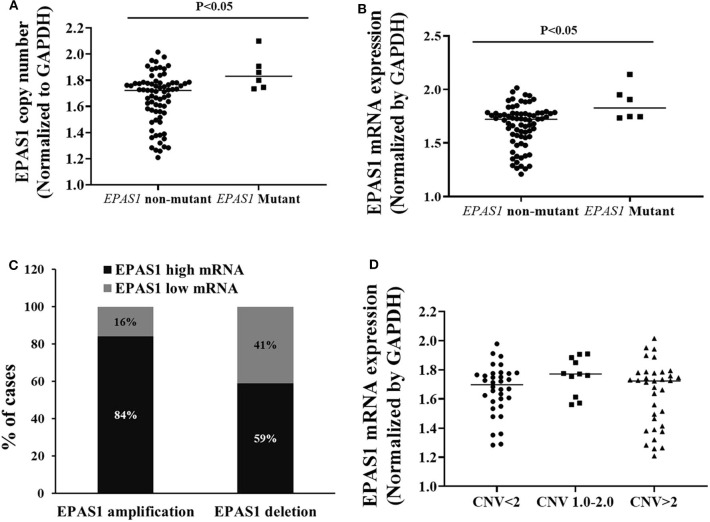
Relationship of EPAS1 molecular dysregulation in ESCC. (A) EPAS1-mutated samples showed significant amplification of DNA number in comparison to that of nonmutated samples (p < 0.05). (B) Similarly, EPAS1-mutated samples exhibited significant higher expression (mRNA) when compared to that of nonmutated tissue samples (p < 0.05). (C) Association of EPAS1 DNA number changes and mRNA expression. RT-qPCR analysis revealed that EPAS1 DNA number amplification significantly correlated with mRNA overexpression (p < 0.01). A 84% patients having EPAS1 DNA amplification showed mRNA overexpression whereas 59% patients with EPAS1 DNA deletion showed mRNA overexpression. (D) Distribution of EPAS1 mRNA expression vs. EPAS1 DNA number in patients with ESCC. Patients with DNA number greater 2 showed higher mRNA expression and DNA number <2 showed lower EPAS1 mRNA expression.

