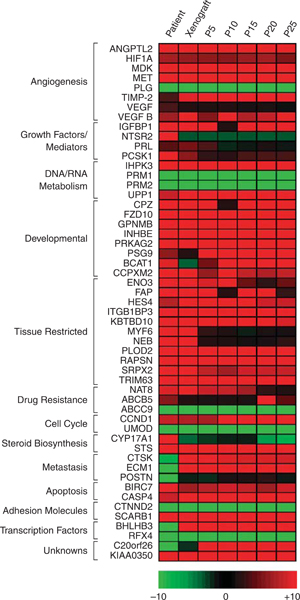
FIGURE 4.
Comparative ASPS gene expression in patient, xenograft, and ASPS-1 Cells. cDNAs derived from ASPS primary tumor, xenografted tumor, and successive passages of the ASPS-1 cell line were hybridized to duplicate U133 plus 2.0 microarrays and independently subjected to pairwise analysis versus array data from universal RNA as described in Materials and Methods. For the 7 transcript lists generated, a subset of differentially expressed mRNAs previously implicated in ASPS pathogenesis was extracted and a heatmap produced showing fold change across the set. ASPS indicates alveolar soft part sarcoma; ASPL-TFE3, alveolar soft part locus-transcription factor E3.

