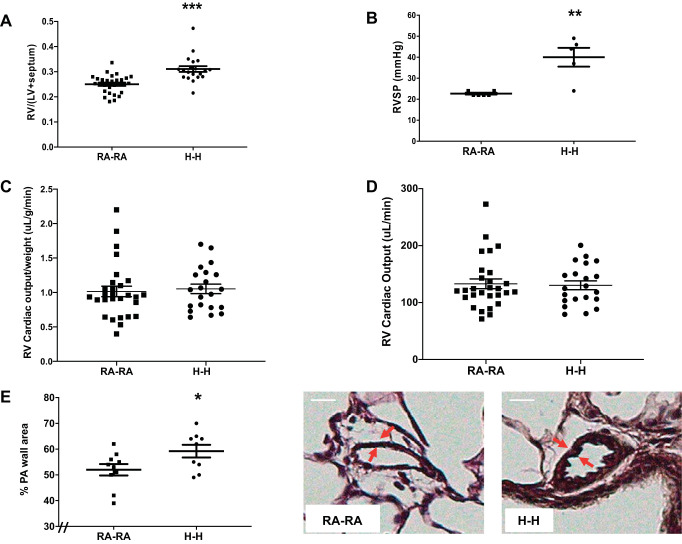
Fig. 5.
Animals exposed to in utero and postnatal hypoxia (H-H) exhibit pulmonary hypertension. A: right ventricular (RV) hypertrophy as measured by the Fulton index [weight of RV divided by weight of left ventricle (LV) plus septum: RV/(LV + septum)]. B: pulmonary hypertension assessment via right ventricular systolic pressure (RVSP) measurement. Cardiac output measurements by echocardiography, both adjusted (C) and unadjusted (D) for animal weight. E: pulmonary artery (PA) remodeling as measured by dividing the PA wall area by the entire vessel area after Verhoeff–van Gieson staining of lung. Representative images are shown. Note increase in PA wall thickness (arrows) in H-H group. RA-RA, in utero and postnatal room air. Error bars represent means ± SE. Analysis by unpaired t test. *P < 0.05, **P < 0.01, ***P < 0.001. Size bar = 10 μm. The “//” marks indicate the figure’s y-axis is offset from zero.

