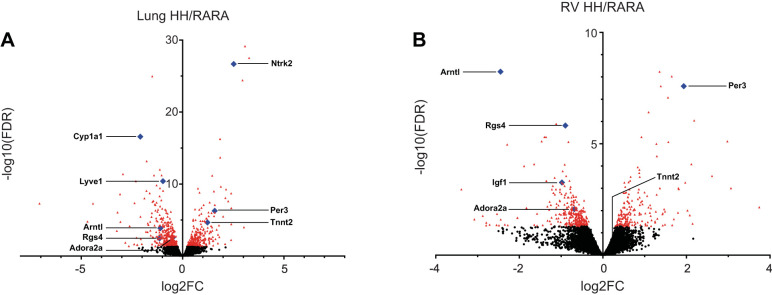
Fig. 6.
Differentially expressed genes in rats exposed to in utero and postnatal hypoxia vs. normoxic controls. Volcano plots are shown for rat lung (A) and right ventricle (RV; B). Each dot represents a gene. Red denotes genes with a false discovery rate (FDR) P value < 0.05 (lung n = 742 genes; RV = 491 genes) with blue highlighting genes validated by quantitative RT-PCR (Table 1). x-axis depicts log2[fold change (FC)] ratios, expressed as hypoxia/room air (H-H/RA-RA), while the y-axis is log10(FDR q-value). See Table 1 for gene names.

