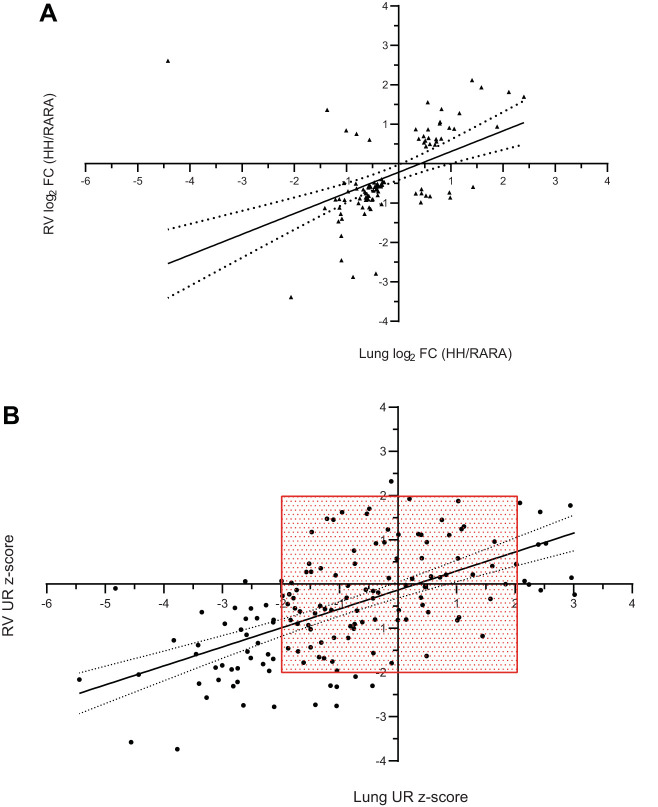
Fig. 9.
Concordant differential gene expression patterns in hypoxia (H-H) vs. room air (RA-RA) rat lung and right ventricle (RV). A: genes in common that were differentially expressed in H-H vs. RA-RA lung and RV [false discovery rate (FDR) P < 0.05; lung n = 742, RV = 491] fold change (FC) ratios are plotted (n = 98 common genes; n = 84 concordant expression; χ2 = 1.15E-07). FC ratios are expressed as H-H/RA-RA treatment. B: all differentially expressed genes from either lung or RV (FDR P < 0.05; lung n = 742, RV = 491) were inputted into Ingenuity Pathway Analysis (IPA). The predicted upstream regulators (URs) from each tissue were aligned for concordant predictions (n = 155 UR predicted in common). The majority of UR predictions had concordant z-score estimates (up/up or down/down; n = 116; χ2 = 7.40E-06). Dashed lines in A indicate 95% confidence limits of the linear best fit model. Red box in B is bounding UR z-score > |2.0| to visualize the IPA suggested cutoff for calling a pathway activated or inhibited. Note that discordant UR predictions all had a z-score < |2.00|, indicating a weakly predicted transcriptional state for discordant URs.

