Figure 1.
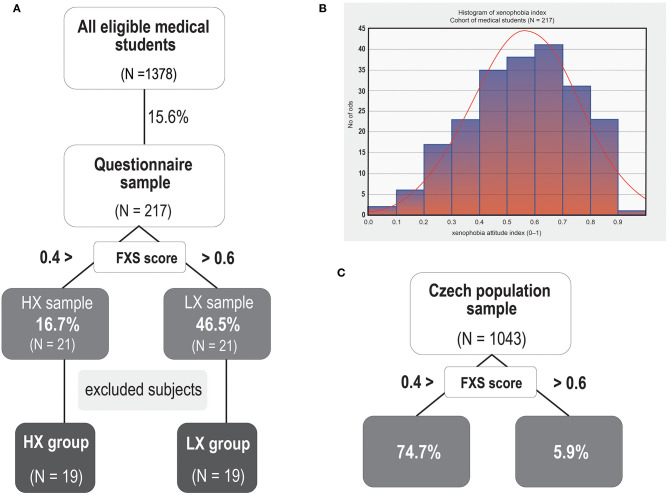
Profile of the experimental sample. (A) Experimental sample distribution and illustration of the recruitment process. (B) Histogram depicting the distribution of results for the Fear-Based Xenophobia (FXS) Scale (a total score ranging from 0 to 1) in the sample of 217 subjects who filled in the short online questionnaire. (C) Distribution of the two opposite poles of FXS scores in the selected sample of the Czech population. Note that when compared to a representative sample of the Czech general population, our participants showed substantially lower levels of xenophobia [with both a lower rate of high xenophobia scores (below 0.4) and a higher rate of the least xenophobic scores (0.6–1) (see % values in diagram A,B)]. Note that the threshold values are different from the stricter inclusion criteria that were applied in the recruitment process (below 0.25 or above 0.75).

