Figure 1.
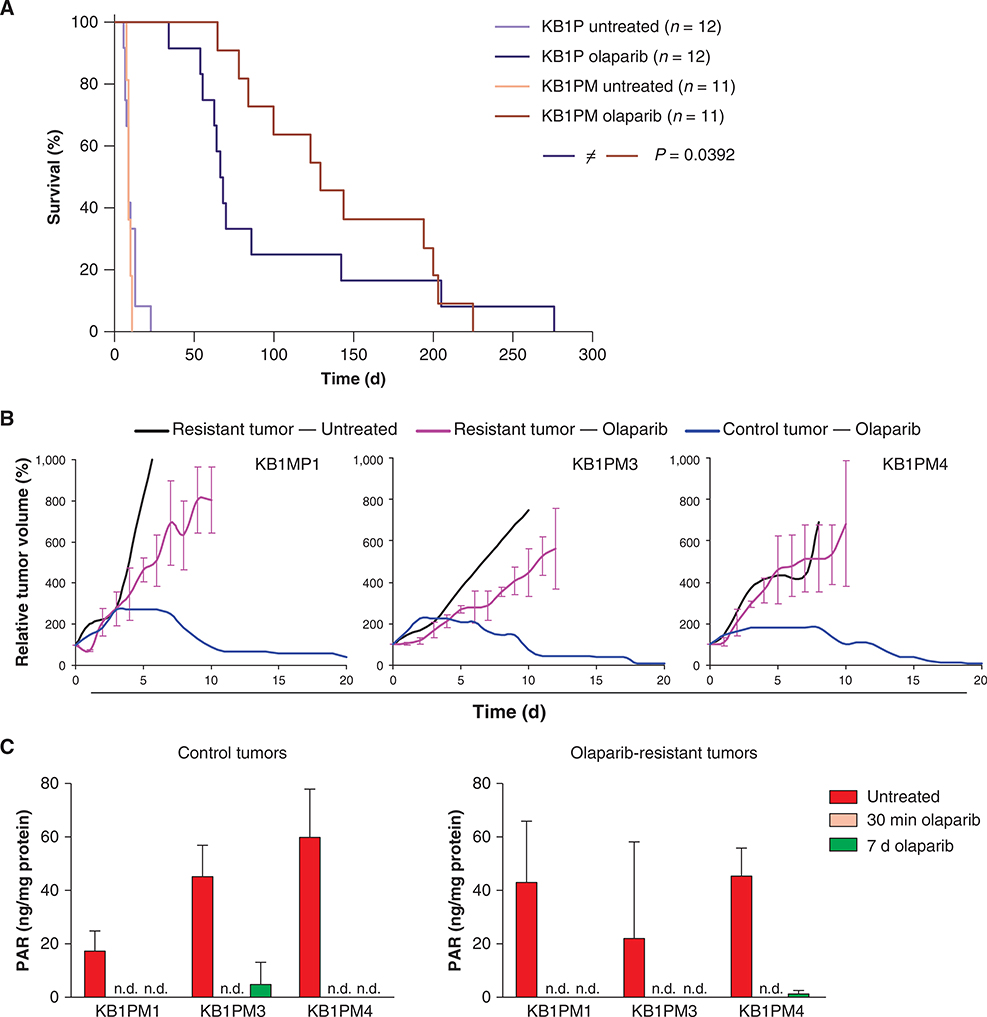
Acquired resistance of Pgp-deficient Brca1Δ/Δ;p53Δ/Δ (KB1PM) mouse mammary tumors to the PARPi olaparib. A, Kaplan–Meier curve showing survival of mice bearing Pgp-proficient KB1P or Pgp-deficient KB1PM tumors, either untreated or treated with 50 mg/kg olaparib given intraperitoneally for 28 consecutive days. Treatment was resumed when a relapsing tumor reached a size of 100% (the tumor size at the start of the treatment). Individual tumor responses are shown in Supplementary Fig. S1. The Gehan–Breslow–Wilcoxon P value is indicated. B, response to daily treatment with 50 mg/kg olaparib given intraperitoneally of olaparib-resistant tumors from 3 donor tumors (KB1PM1, 3, and 4) and drug-naïve control tumors from the corresponding donors. C, levels of PAR detected in whole-tumor extracts from olaparib-resistant and control tumors derived from KB1PM1, KB1PM3, and KB1PM4. The tumors were harvested without treatment, 30 minutes after one dose of 50 mg/kg olaparib given intraperitoneally, or 2 hours after the last dose of 7 days of daily treatment. n.d., not detectable (lower than 2*SD above background). Data are presented as mean + SD of 3 mice per donor per treatment.

