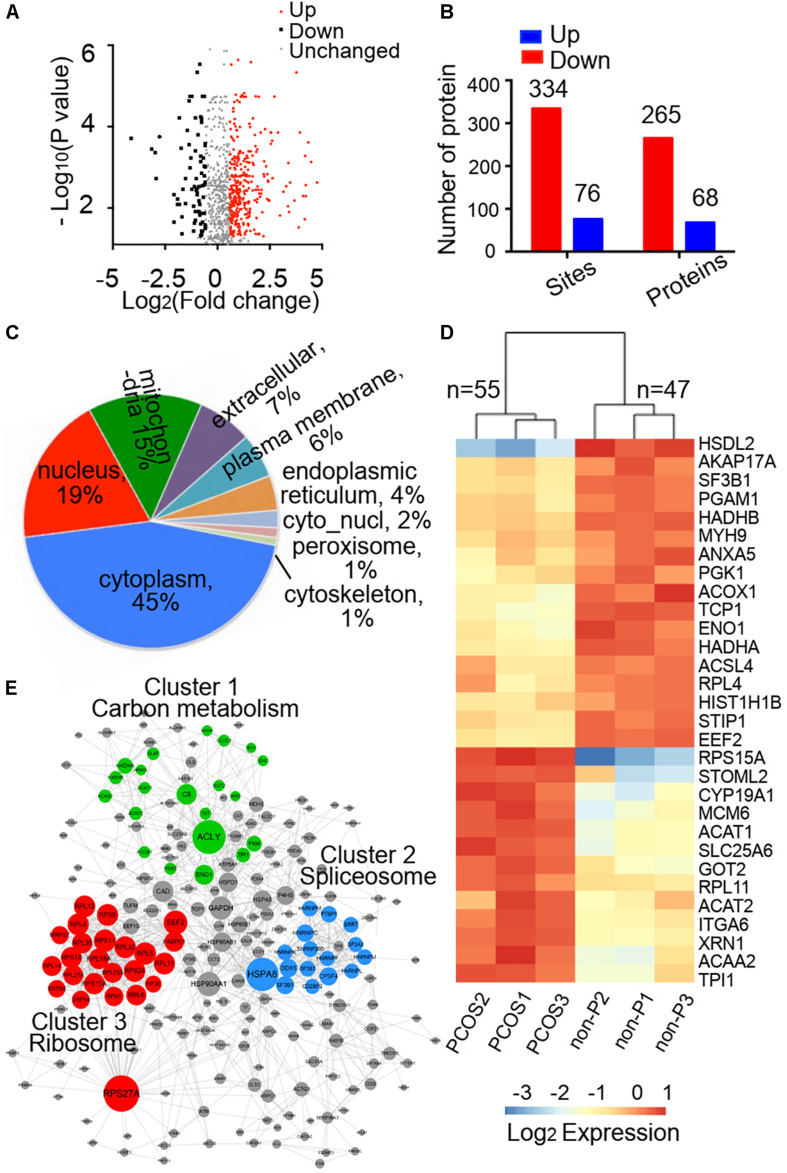
FIGURE 2.
Identification of differentially acetylated proteins and bioinformatics analysis. (A) Volcano plot showing differential acetylated proteins between PCOS and control groups, and the differential expression multiples were more than 1.5. (B) Number of differentially acetylated sites and proteins in the PCOS group when compared with the control group. (C) Subcellular localization predication of differentially acetylated proteins using WoLF PSORT software. (D) Heatmap of top 30 of differentially acetylated proteins. The clustering results were shown in triplicate samples from PCOS and control groups. (E) Protein–protein interaction network analysis of differentially acetylated proteins extracted from the STRING database.

