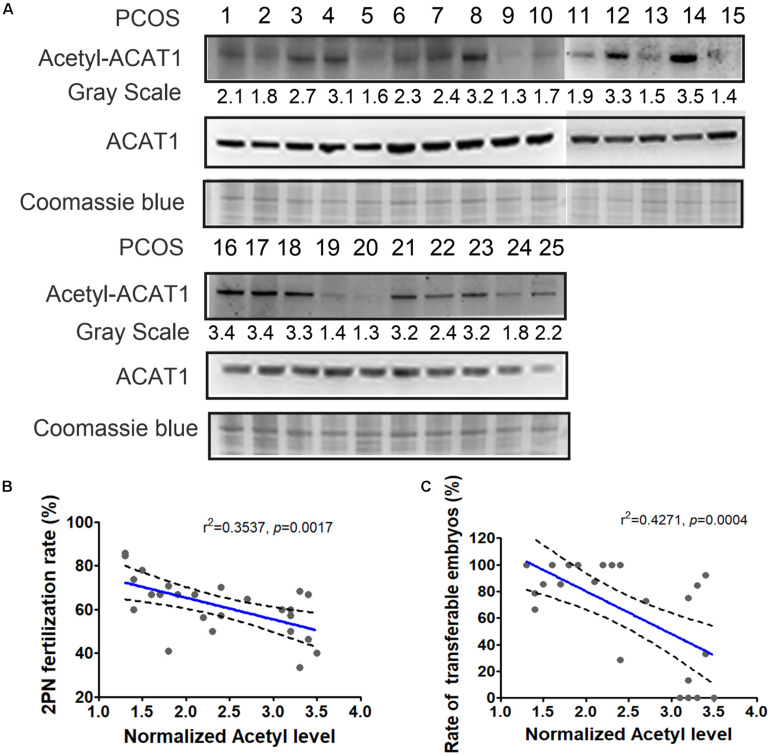
FIGURE 6.
Correlation of ACAT1 acetylation levels in PCOS granulosa cells with clinical outcomes. (A) Detection of ACAT1 acetylation in granulosa cells of 25 PCOS patients. Loading control was Coomassie blue staining. The acetylation value (grayscale ratio) was normalized with Coomassie blue staining. When the ratio of the acetylation level of ACAT1 Lys-174 to the expression level of ACAT1 protein was more than 2, it was classified as hyperacetylation subgroup, while the hypoacetylation subgroup was defined when the ratio was less than 2. (B,C) showed the correlation analyses of ACAT1 acetylation levels with the 2PN fertilization rate and rate of transferable embryos. R: Pearson correlation coefficient.

