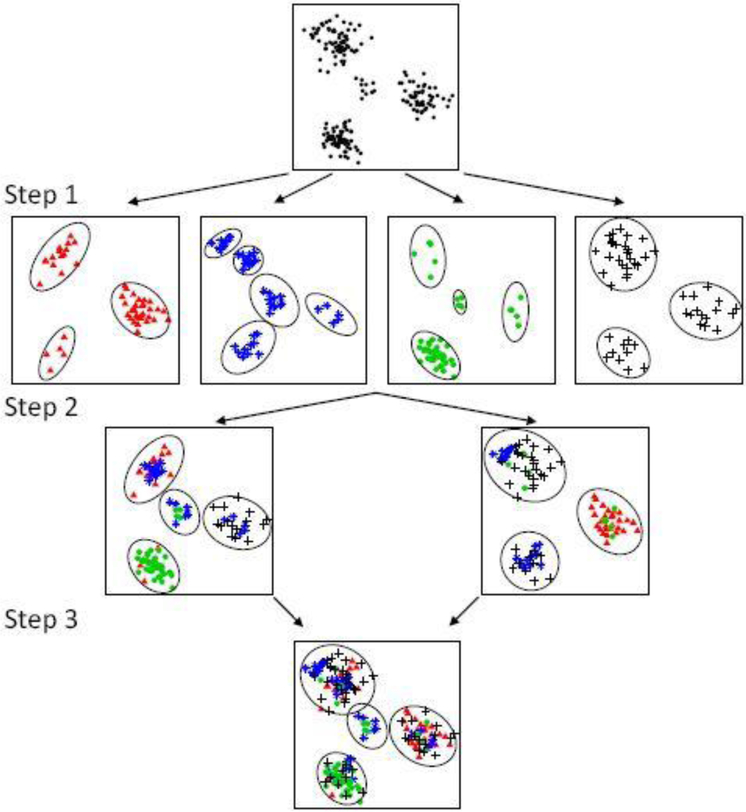
Fig. 1.
Example workflow of a 3-step SIGN algorithm. Step 1: the dataset is randomly distributed into 4 shards, each denoted by a unique type (color) of marker and observations are partitioned into local clusters (represented by the ellipses) within each shard in parallel. Step 2: local clusters are collected, randomly distributed into M2 = 2 shards, and then partitioned into regional clusters within each shard. Step 3: regional clusters are aggregated and partitioned into global clusters.

