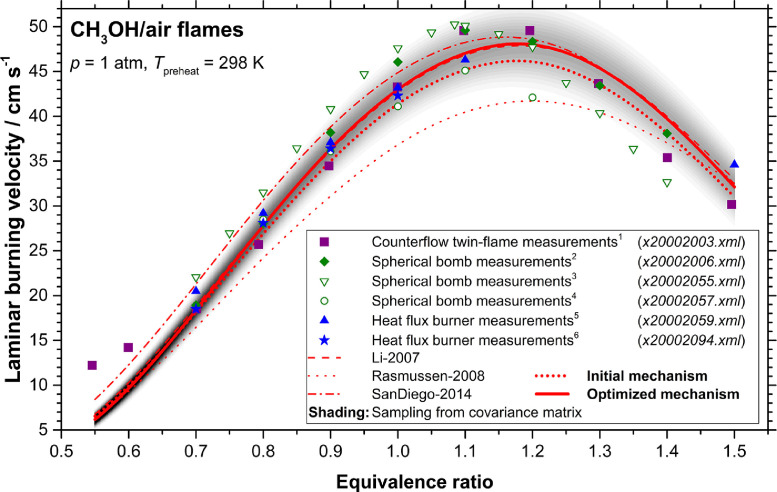
Fig. 22.
Simulation results vs. experimental data for methanol/air flames at T=298 K and p=1 atm; comparison of the optimized and initial mechanisms against several published mechanisms and experimental data. At each temperature, the gray shading represents the PDF of the branching ratios calculated from the posterior covariance matrix. Experimental uncertainties and further details are given in the original paper. Reprinted from [362] with permission from Elsevier/The Combustion Institute.

