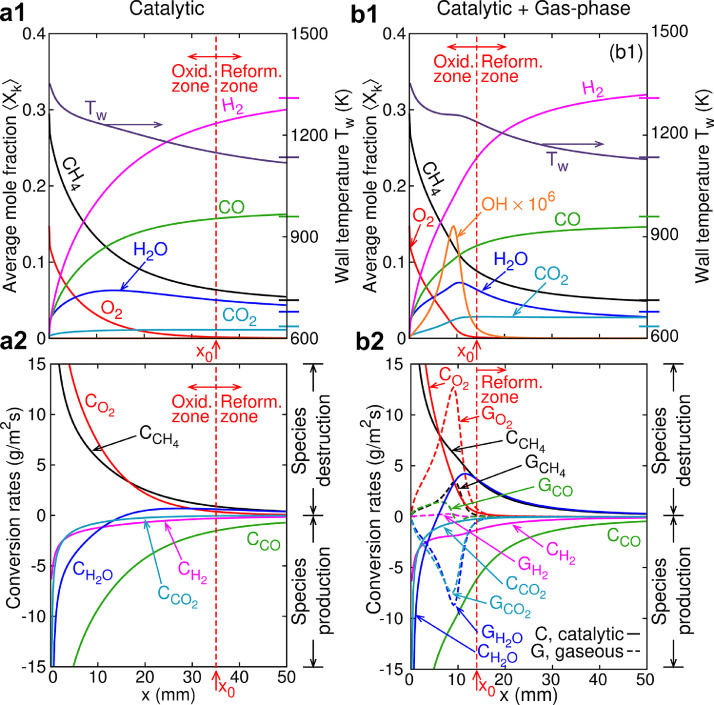
Fig. 28.
(a1, b1) Streamwise profiles of wall temperature and radially-averaged species mole fractions and (a2, b2) species conversion rates for Case B: (a1, a2) with only catalytic chemistry and (b1, b2) with catalytic and gas-phase chemistry. C and G refer to catalytic and gaseous conversion rates, respectively. Horizontal ticks on the right ordinates of (a1, b1) provide the adiabatic equilibrium compositions and temperature. The axial locations marked x0 and the vertical dashed lines delineate the end of the oxidation zone. Reprinted from [419] with permission from Elsevier/The Combustion Institute.

