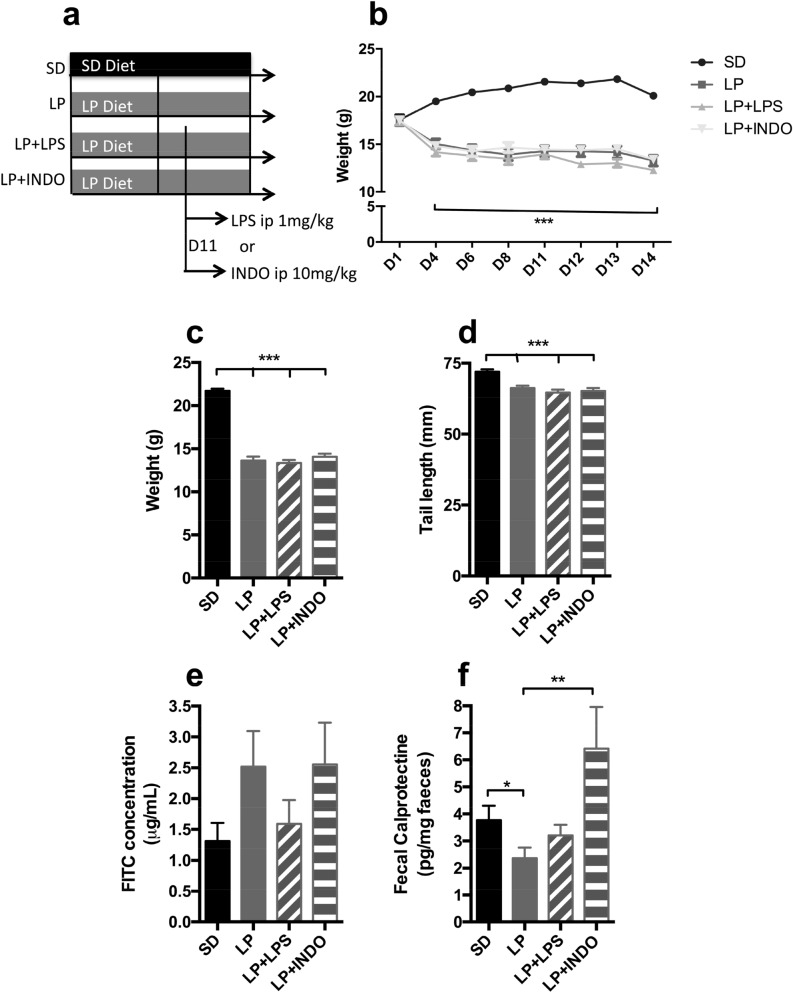
Figure 2.
Growth, intestinal inflammation and permeability assessment in C57BL/6 mice fed a low protein in combination with lipopolysaccharide or indomethacin i.p. injection. (a) 3-weeks-old mice were fed with standard or isocaloric low protein diet post weaning during 14 days. At day 11, mice received a single intraperitoneal injection of LPS (1 mg/kg) or indomethacin (10 mg/kg). (b) Body weight was recorded at D1, D4, D6, D8 and every day from D11 until the end of the experimentation (n = 20 per group). Plots represent the mean ± SEM (***P < 0.001 vs. SD, Two Way ANOVA). At D14, (c) weight (n = 20 per group) and (d) tail length (n = 20 per group) were calculated. Bars indicate the mean ± SEM. One-way analysis of variance with post hoc Tukey’s test was performed (***P < 0.0001). (e) Bars indicate the mean ± SEM of the FITC concentration serum (assessed 3 h post per os administration; n = 20 per group). Kruskal Wallis test with post hoc Dunn's multiple comparison test was performed. (f) Bars indicate the concentration of fecal calprotectin in mice at D21 (n = 20 per group). Unpaired t-test (*p = 0.0423) or Mann–Whitney test was performed (**p = 0.0044). SD, Standard diet; LP, Low protein diet; LP + LPS, Low protein diet + i.p. injection of lipopolysaccharides; LP + INDO, LP + i.p. injection of indomethacin.

