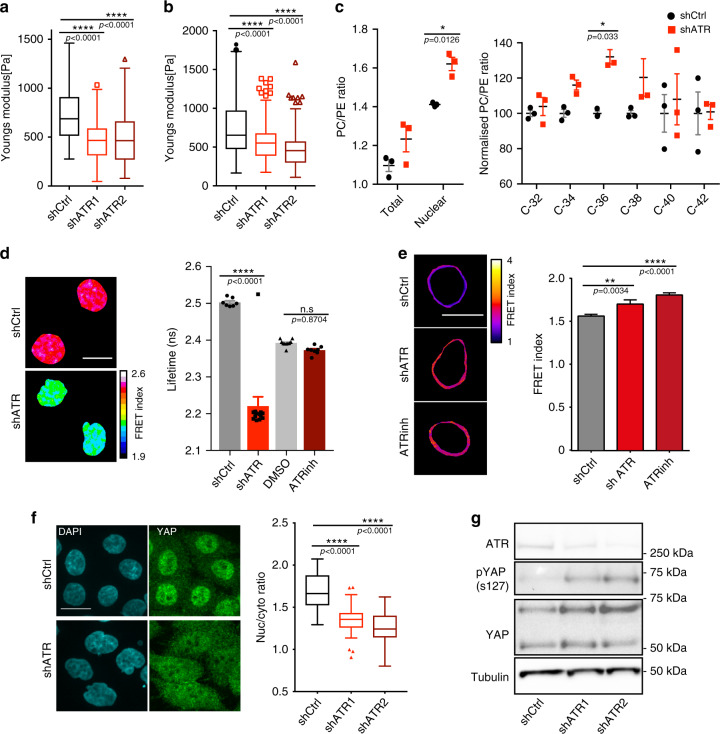
Fig. 2. ATR preserves nuclear mechanics.
a, b Elastic modulus measurements using AFM. a Cellular stiffness (n = 171, 161, and 179 measurements for shCtrl, shATR1, and ShATR2, respectively) and b stiffness of isolated nuclei from control and ATR-depleted cells (n = 144, 110, and 98 measurements; N = 2 independent experiments). c Membrane phospholipid composition analysis; total cell and nuclear membrane PC/PE ratio, nuclear PC/PE ratio of individual species (from three biological and two technical replicates; two-way ANOVA test; Bonferroni’s multiple comparisons test; N = 2 independent experiments). d FLIM-FRET analysis of cells expressing H2B-GFP and H2B-mCherry; sample images of Fluorescent lifetime (FLIM-FRET index) and overall Lifetime in Hela cells infected with shATR (n = 13) or control (n = 7), or treated with DMSO (n = 10) or ATR inhibitor for 4 h (n = 8). e Examples of FRET signals at the NE as measured by Nesprin-2 FRET sensor in control, shATR, and control cells in the presence of ATR inhibitor (3 h), and quantification of FRET signals (n = 112, 88, and 96 measurements for shCtrl, shATR1, and ShATR2 respectively; data pooled from two or three independent experiments). f Immunofluorescent images of YAP cellular distribution in control and shATR cells, (below) quantifications of nuclear to cytoplasmic YAP signal ratio (n = 69, 66, and 58 shCtrl, shATR1, and ShATR2, respectively). g Western blotting of ser127-phosphorylated YAP (N = 2 independent experiments. Uncropped images available in Source Data file). Scale bar is 20 μm in all images. Bar graphs presented as mean ± SEM and box plot whiskers and outliers plotted using Tukey’s method in prism7 software. p-values calculated using one-way ANOVA test with Tukey’s multiple comparisons test (for d) or Dunnett’s multiple comparisons test (for a, b, e, f). (****P < 0.0001; ***P < 0.001; **P < 0.01; *P < 0.05; n.s., not significant).

