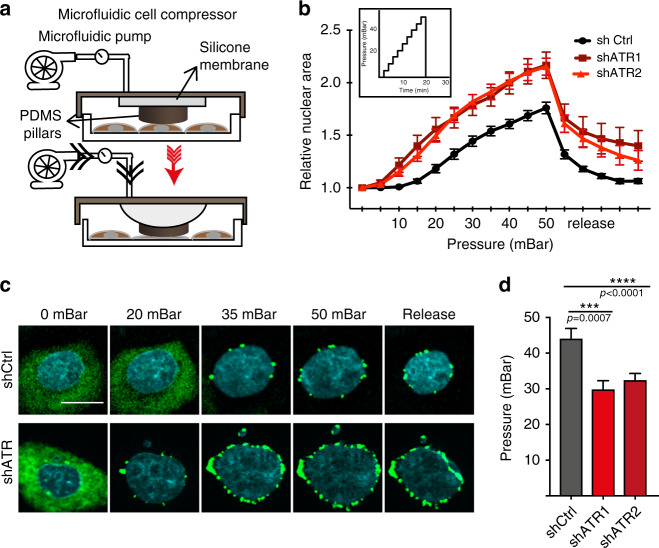
Fig. 3. ATR-defective cells undergo nuclear collapse upon mechanical compression.
Mechanical compression using a microfluidic compression device. a Design and b graph of compression-induced nuclear deformation with respect to the pressure applied, represented as ratio of its initial uncompressed area. In inlet, graph representing step-wise increase of pressure used for the experiment. c Time-lapse images of perinuclear cGAS foci formation in control and ATR-depleted cells under compression. d Amount of pressure applied through the microfluidic pump during the time of NE rupture (formation of first foci of cGAS) (n = 19, 24, and 21 shCtrl, shATR1, and ShATR2, respectively; data pooled from N = 2 independent replicates). All graphs presented as mean ± SEM. p-values are calculated using two-way ANOVA test and Tukey’s multiple comparisons test for b and one-way ANOVA test with Dunnett’s multiple comparisons test for d (**** if P < 0.0001, *** if P < 0.001).

