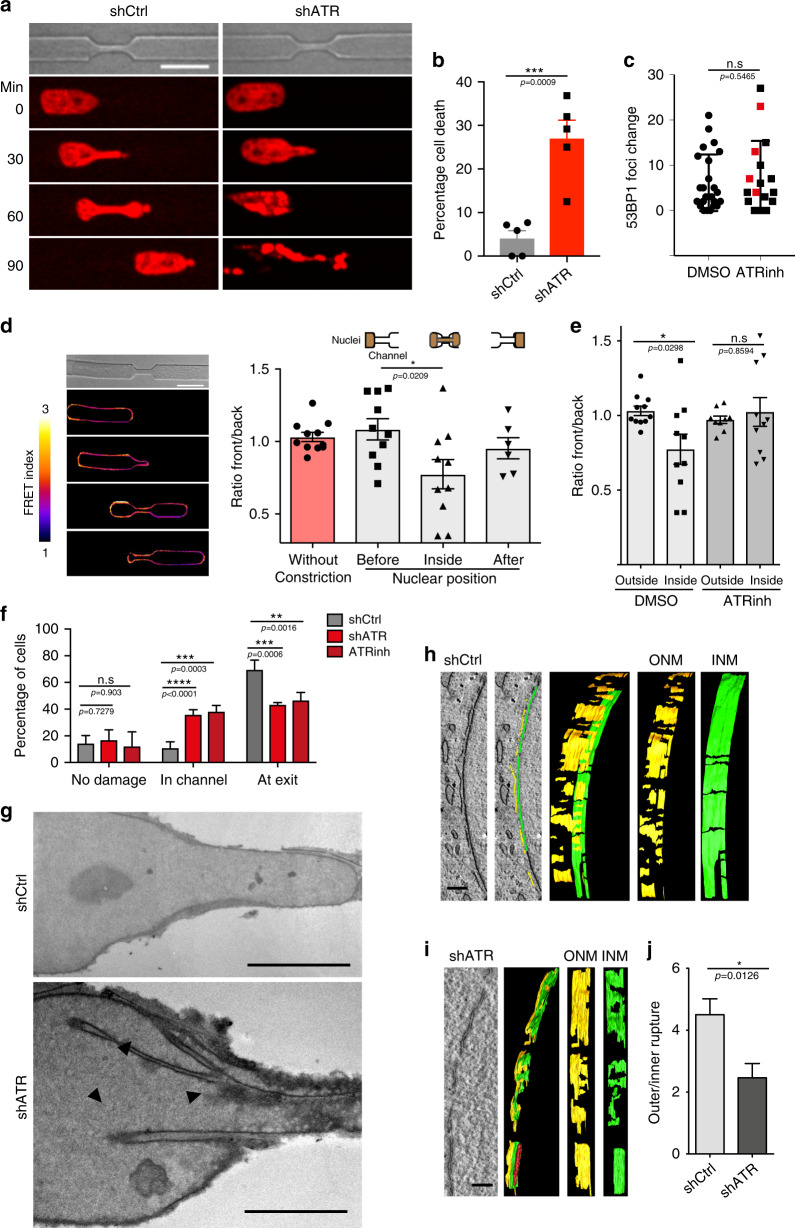
Fig. 4. ATR-defective nuclei are inefficient in migrating through narrow pores.
a Snapshots of H2B-mCherry labeled control and shATR nuclei passing through constriction. b Cell death measured as the percentage of engaged cells that burst at the constriction (n = 122 and 88 cells for shCtrl and shATR1; data pooled from three independent experiments). c Quantification of 53BP1-GFP foci generated due to constriction in HeLa cells expressing 53BP1-GFP in the presence of DMSO or ATR inhibitor, VE-821 (n = 24 and 17 for DMSO and ATRinh; pooled from two independent experiments). Cells that undergo cell death in the constriction are highlighted in red (for ATRinh). d, e FRET signal measurements of cells engaged in constrictions. d Images of FRET signal at various stages of migration through the constriction and measurement of signal ratio between front (leading half of the nucleus) and back (lagging half of the nucleus) of a nuclei at various stages of migration (n = 11, 10, 10, and 6, respectively). e Ratio of front to back FRET signal in migrating cells (inside or outside the constriction) in the presence DMSO or ATRinh (n = 11, 10, 9, and 10; data from 2 to 3 experiments). f Quantification of nuclear position in the constriction during the first cGAS foci formation (n = 47, 43, and 28; numbers pooled from 3 experiments). g EM images of control and shATR nuclei in constriction (routine 200 nm EM sections). Arrowheads indicate invaginations and NE attached chromatin or nucleoli. h 3D reconstruction of NE at the leading edge from control nucleus in constriction. Green color indicates inner nuclear membrane (INM) and yellow indicates outer nuclear membrane (ONM). i 3D reconstruction of NE section from leading edge of shATR nucleus in constriction. j Quantification of ratio between number of inner nuclear membrane breaks to that of the outer membrane (n = 15 and 13). Scale bar for a, d is 20 μm, for g is 9 μm, and for i, h is 200 ηm). Bar graphs presented as mean ± SEM and dot-plot as mean ± SD. P-value calculated using two-tailed Student’s t-test for b, c, j. One-way ANOVA for d, e with Tukey’s or Sidak’s multiple comparisons test, and two-way ANOVA for f (****P < 0.0001, ***P < 0.001, **P < 0.01, and *P < 0.05; n.s., not significant).

