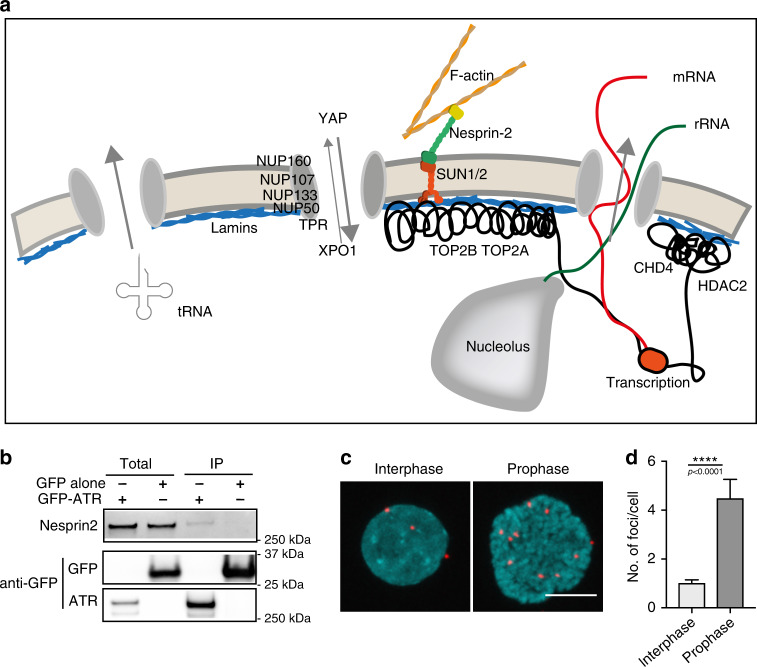
Fig. 6. ATR interactors.
a Schematic summary of ATR interactors and their relative roles at the nuclear envelope and perinuclear areas b Validation of Nesprin-2 and ATR interaction using GFP-ATR immunoprecipitation and western blot analysis (full blots of Nesprin-2 with molecular weights included in Supplementary Fig. 4h and in Source data file). c Example of ATR–Nesprin-2 interaction foci generated by proximity ligation assay (PLA) in interphase and prophase cells (scale bar = 10 μm). d Quantification of total number of foci present in interphase and prophase cells (n = 65 for interphase and 10 for mitosis, pooled from 2 independent experiments). Graph presented as mean ± SEM. p-value calculated using two-tailed Student’s t-test.

