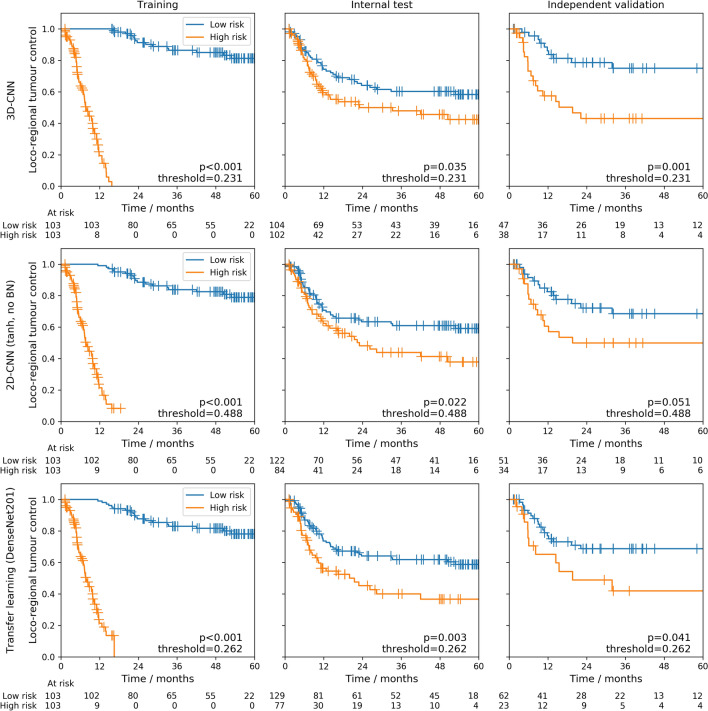
Figure 4.
Ensemble Kaplan–Meier curves: Kaplan–Meier curves for patient groups at low risk (blue) and high risk (orange) of loco-regional recurrence for training and internal test folds as well as for the independent validation cohort. The stratification was created using the median of the training ensemble predictions as cutoff. The top row shows the curves obtained from an ensemble of 3D-CNN models trained from scratch based on the architecture of Hosny et al.23 with as final activation. The centre row shows the curves obtained from an ensemble of 2D-CNN models trained from scratch without batch normalisation and as final activation. The bottom row shows the curves obtained from an ensemble of transfer learning models based on DenseNet201 with the last convolutional layer as foundation.

