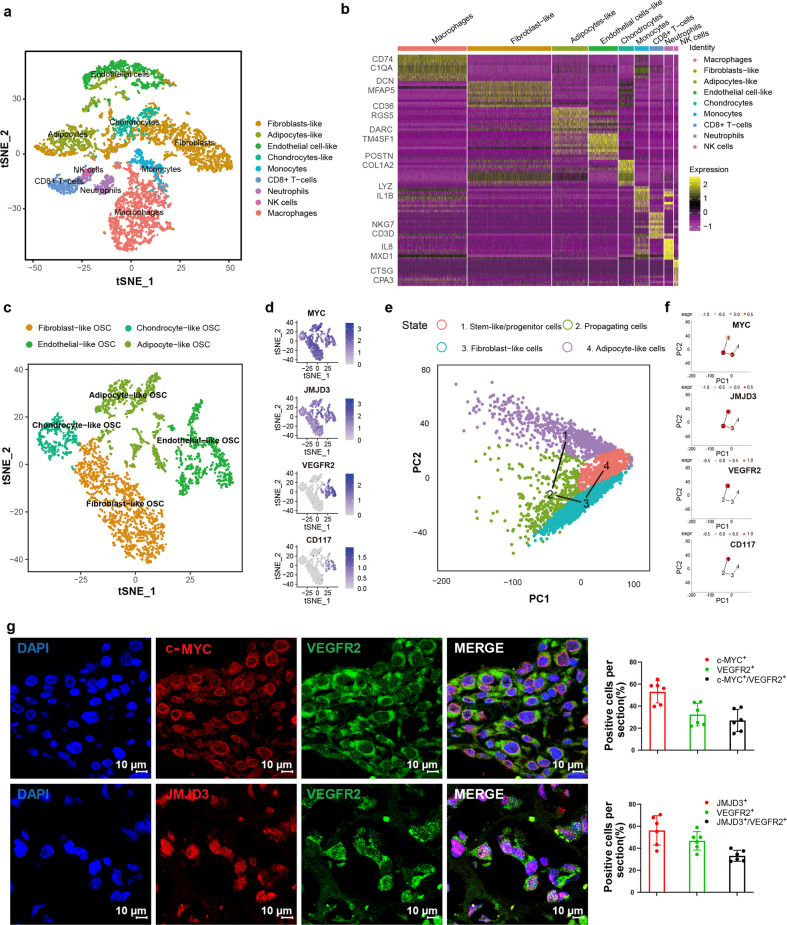
Fig. 1.
scRNA-seq transcriptome illustrates the heterogeneity of osteosarcoma in a chemotherapy-resistant patient. a t-SNE and clustering analysis of single-cell transcriptome data from osteosarcoma (n = 7177). b Heatmap showing the top 10 differentially expressed genes (DEGs) between clusters. Each row represents a gene, and each column represents a single cell. c Re-clustering and focused analysis of the osteosarcoma cells (OSC) (n = 3168). d t-SNE plots of expression of osteosarcoma-associated markers. e Pseudo-time (via TSCAN) ordering of distinct populations within therapy-resistant osteosarcoma. f TSCAN plots showing the expression of JMJD3 and VEGFR2 in stem-like/progenitor populations. Expr expression level. g Immunofluorescence staining showed that MYC+/JMJD3+ or JMJD3+/VEGFR2+ double-positive cell subsets were found in the chemo-resistant osteosarcoma samples (n = 6). The scale length of each image is 10 μm

